
Featured Article
How Data Enrichment Transforms Basic Analytics into Business Intelligence
Explore how external context can turn ordinary metrics into powerful insights that drive better decision-making across your organization.
Read more
Explore guides, case studies, and tools designed to help you maximize the value of visual intelligence.
Explore how external context can turn ordinary metrics into powerful insights that drive better decision-making across your organization.

Understand the critical external variables influencing your business performance and how to incorporate them into your analytics.

Learn how a commercial real estate firm increased portfolio value by 15% through better market understanding and property positioning
Discover how a mid-sized manufacturer reduced supply chain disruptions by 35% using VisLogic's predictive analytics and digital twin technology.
See how a digital marketing agency differentiated their services and improved client results through contextual data enrichment.
Learn how a regional healthcare network optimized staffing and resource allocation through better demand prediction and scenario planning.
Browse our library of industry-specific templates designed to get you started quickly. Each template includes pre-configured visualizations, recommended data sources, and customization options to fit your specific needs.


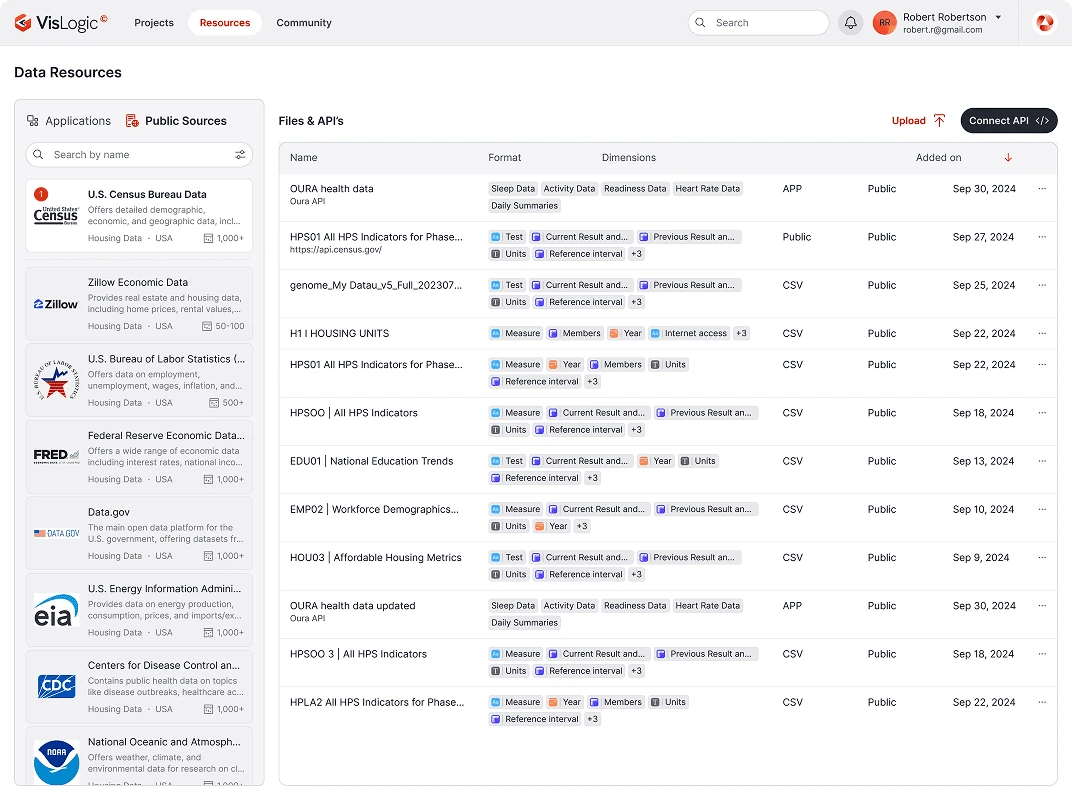
Detailed information about available data enrichment sources, including update frequencies, coverage areas, and integration methods.
Detailed information about available data enrichment sources, including update frequencies, coverage areas, and integration methods.
Comprehensive reference materials for developers looking to integrate with VisLogic's platform or extend its capabilities.
Access to knowledge base articles, video tutorials, and support contact information.