Play
Solutions designed for your specific challenges, with templates and enrichment sources tailored to your industry.
VisLogic connects with your critical business systems out of the box, making it easy to import, enrich, and visualize your data without complex ETL processes. Our platform features both native integrations with popular business software and flexible API options for custom connections.
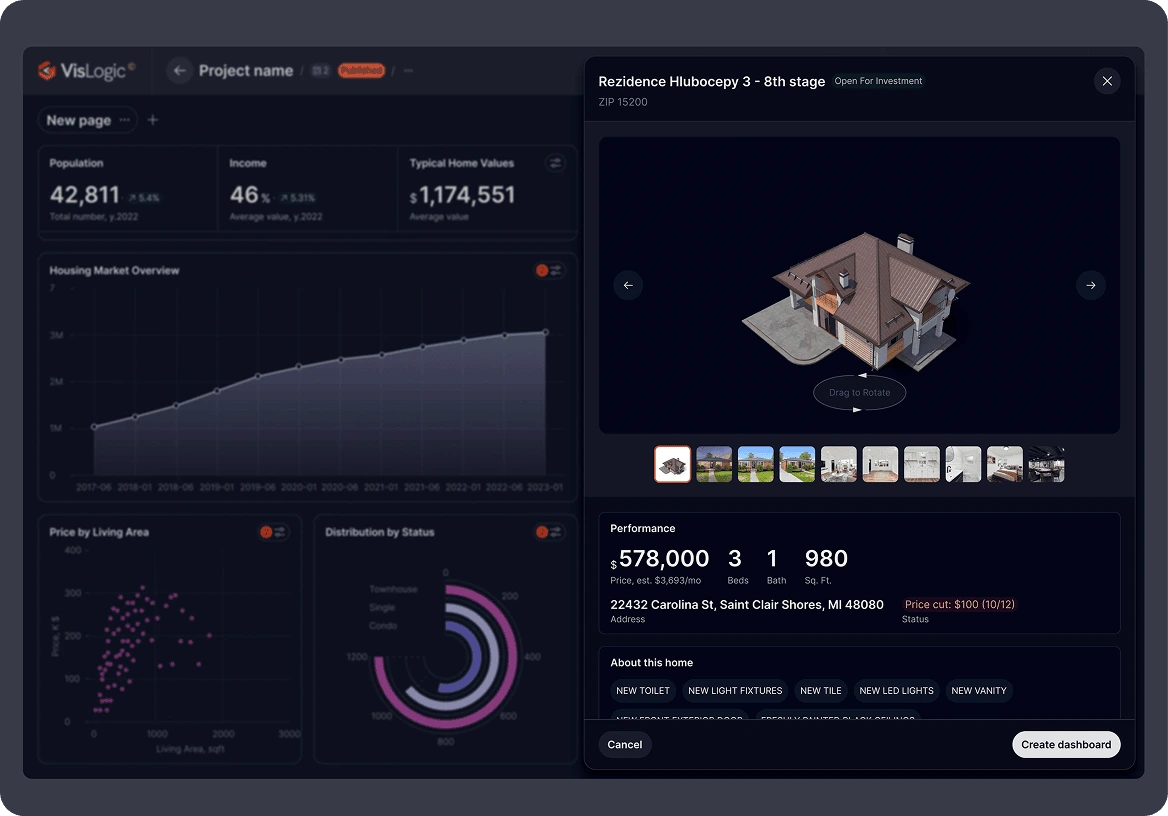
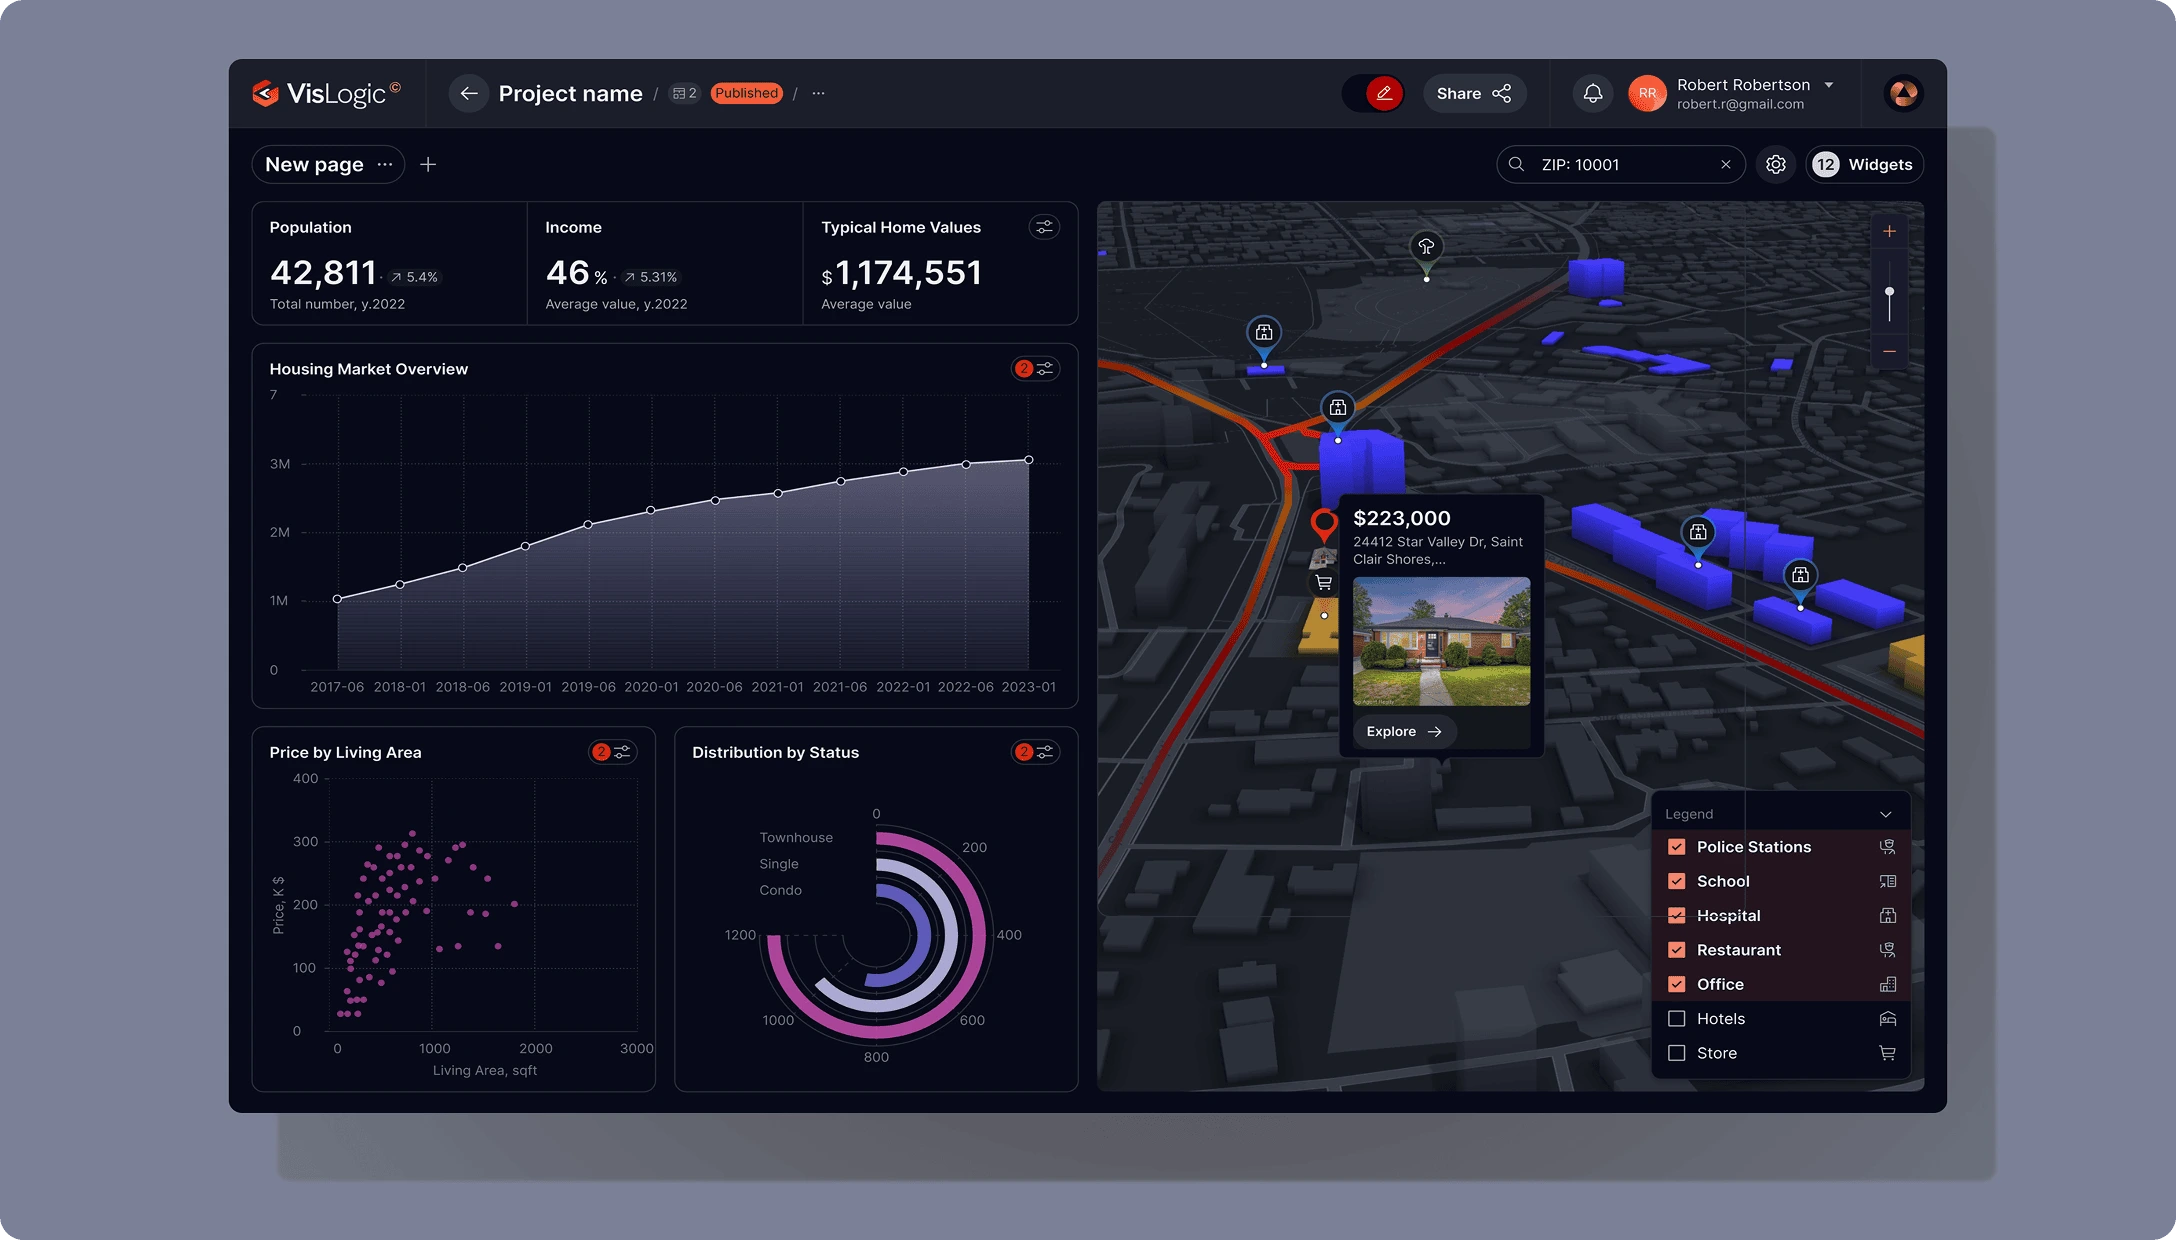
This template combines your property data with market benchmarks, demographic trends, and economic indicators to create a comprehensive view of portfolio performance. Customizable visualizations highlight key metrics, identify outliers, and surface opportunities for optimization.
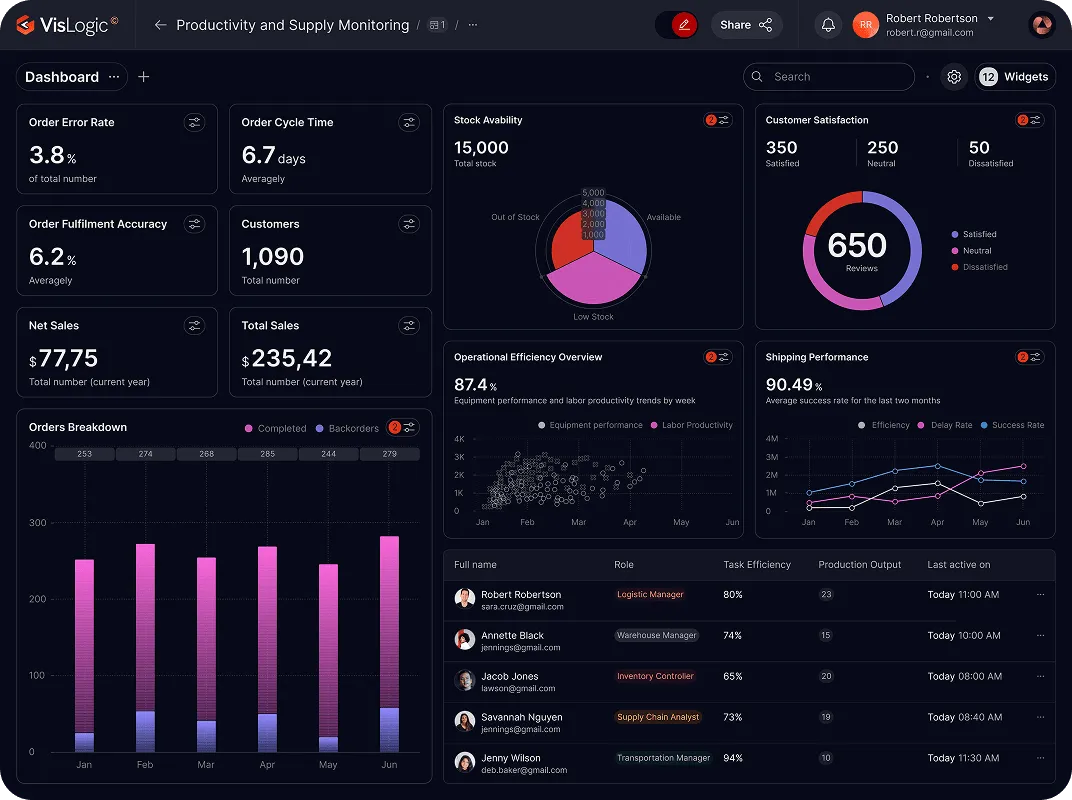
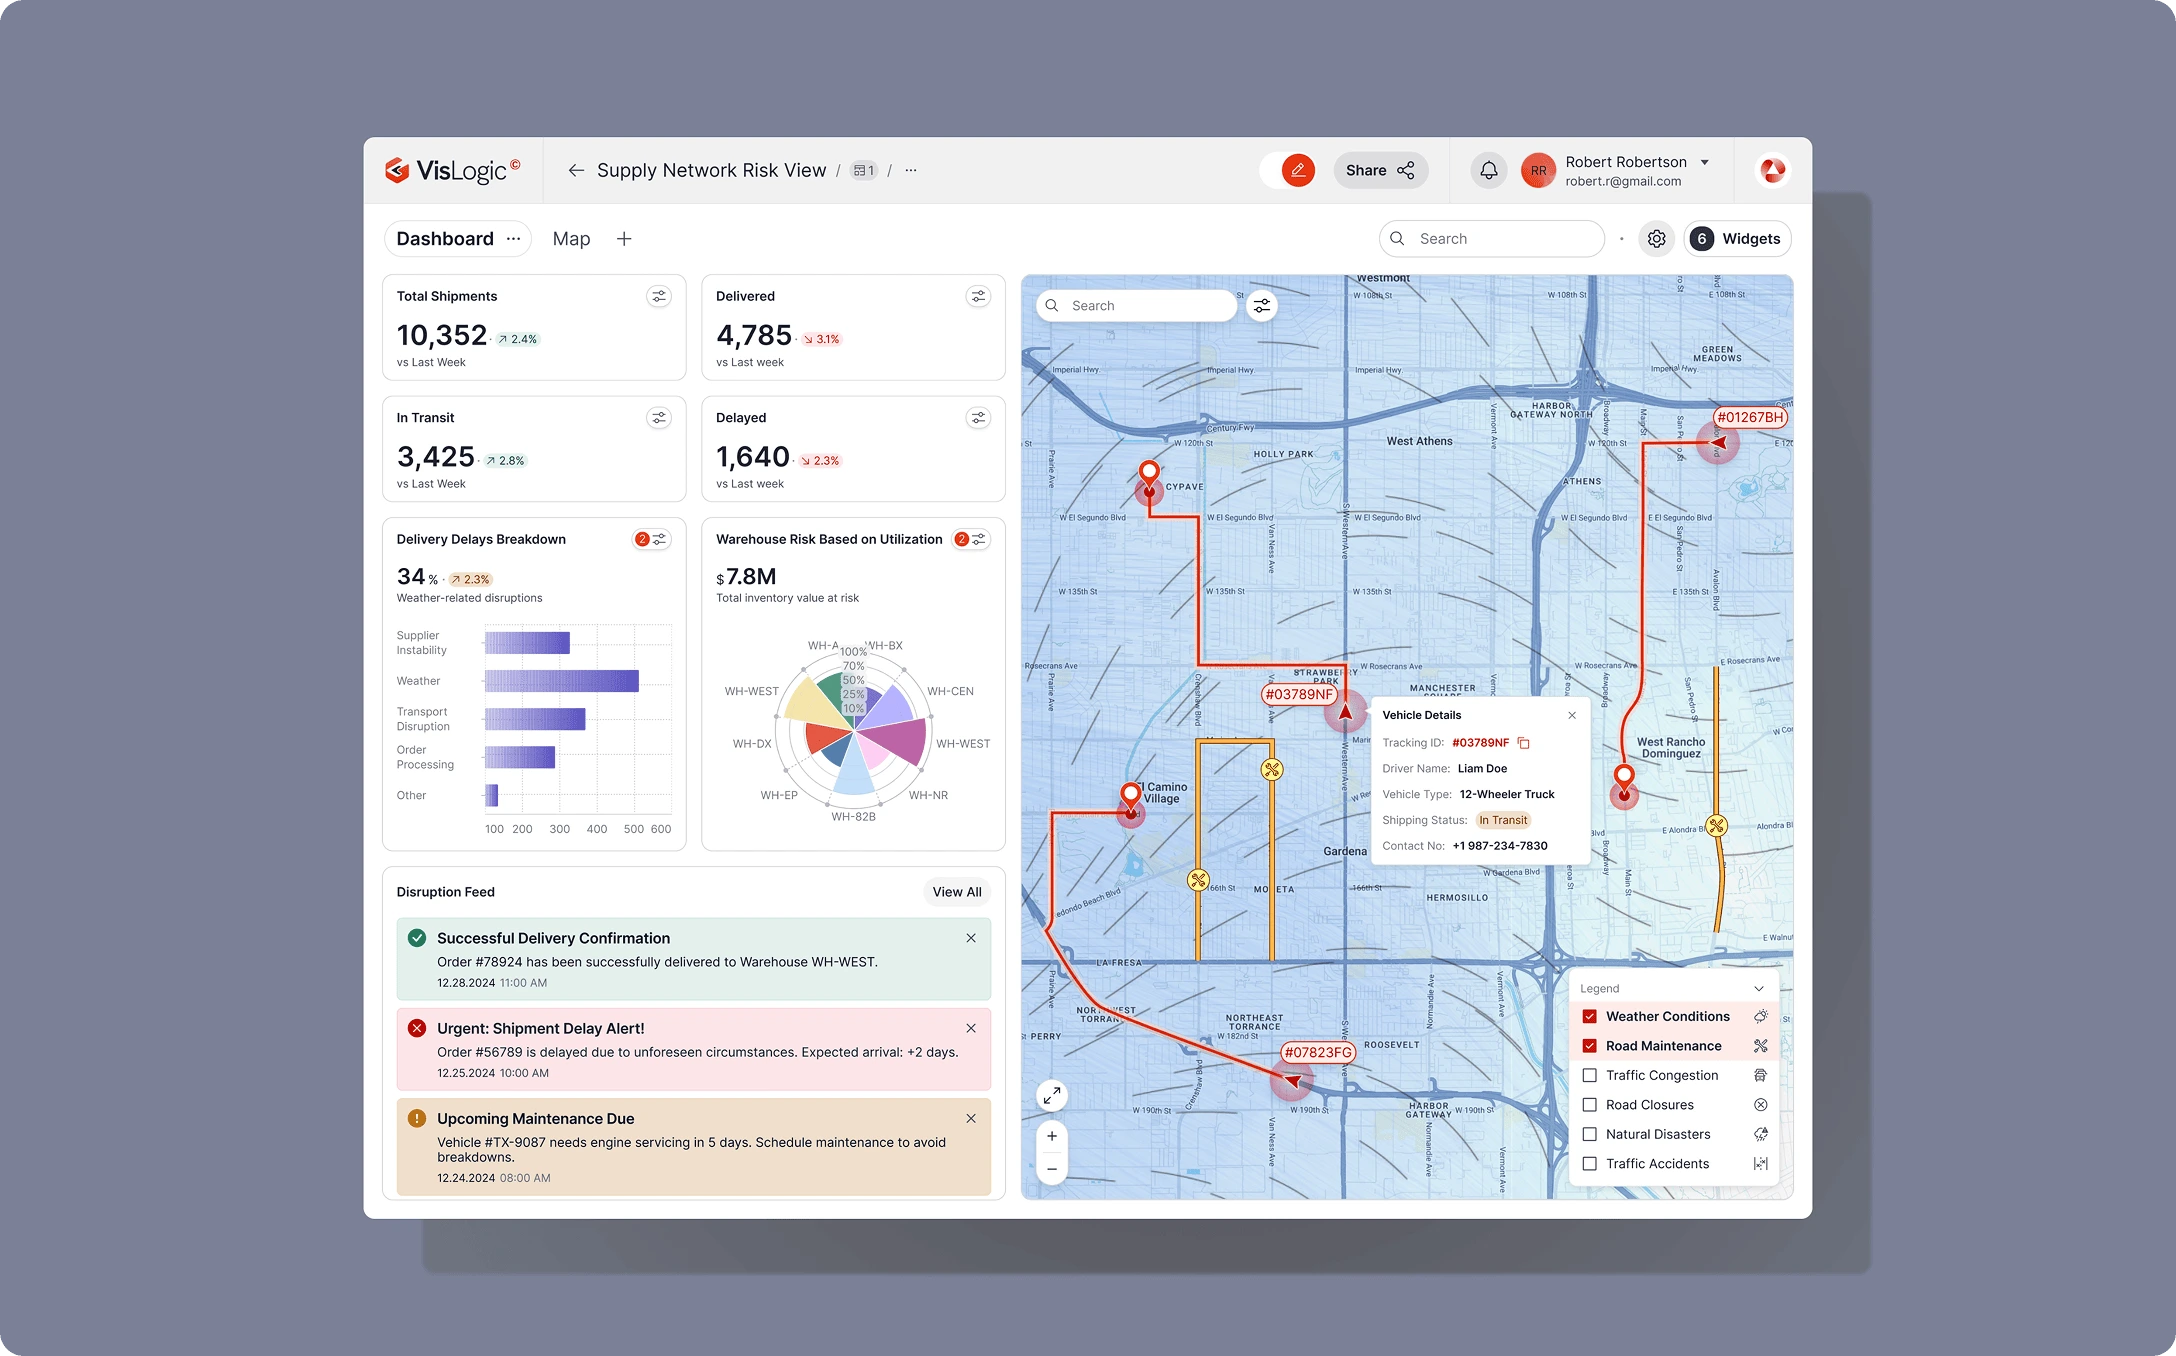
VisLogic helps manufacturers connect operational data with external factors affecting production, supply chain, and market demand. Our platform enables manufacturing leaders to anticipate disruptions, optimize operations, and make data-driven decisions that reduce costs and improve efficiency.
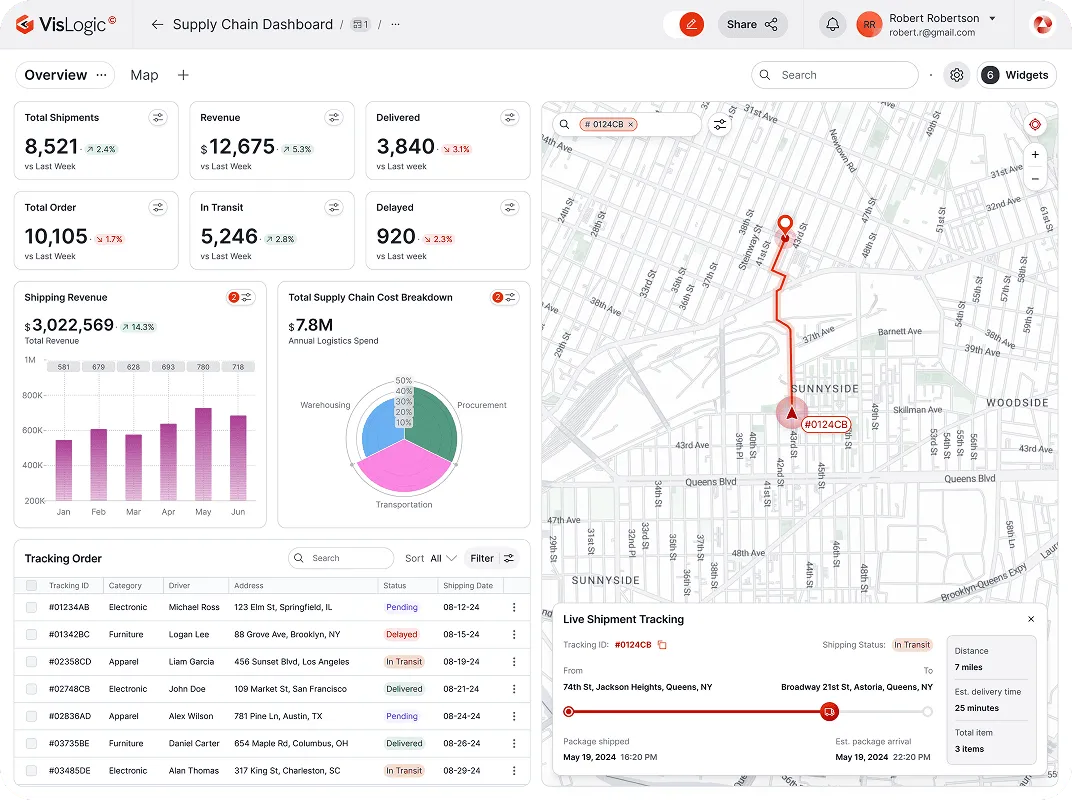
This template integrates your supplier and logistics data with global risk factors, weather patterns, and transportation conditions. Interactive visualizations highlight potential disruptions, alternative sourcing options, and recommended inventory adjustments based on real-time conditions.
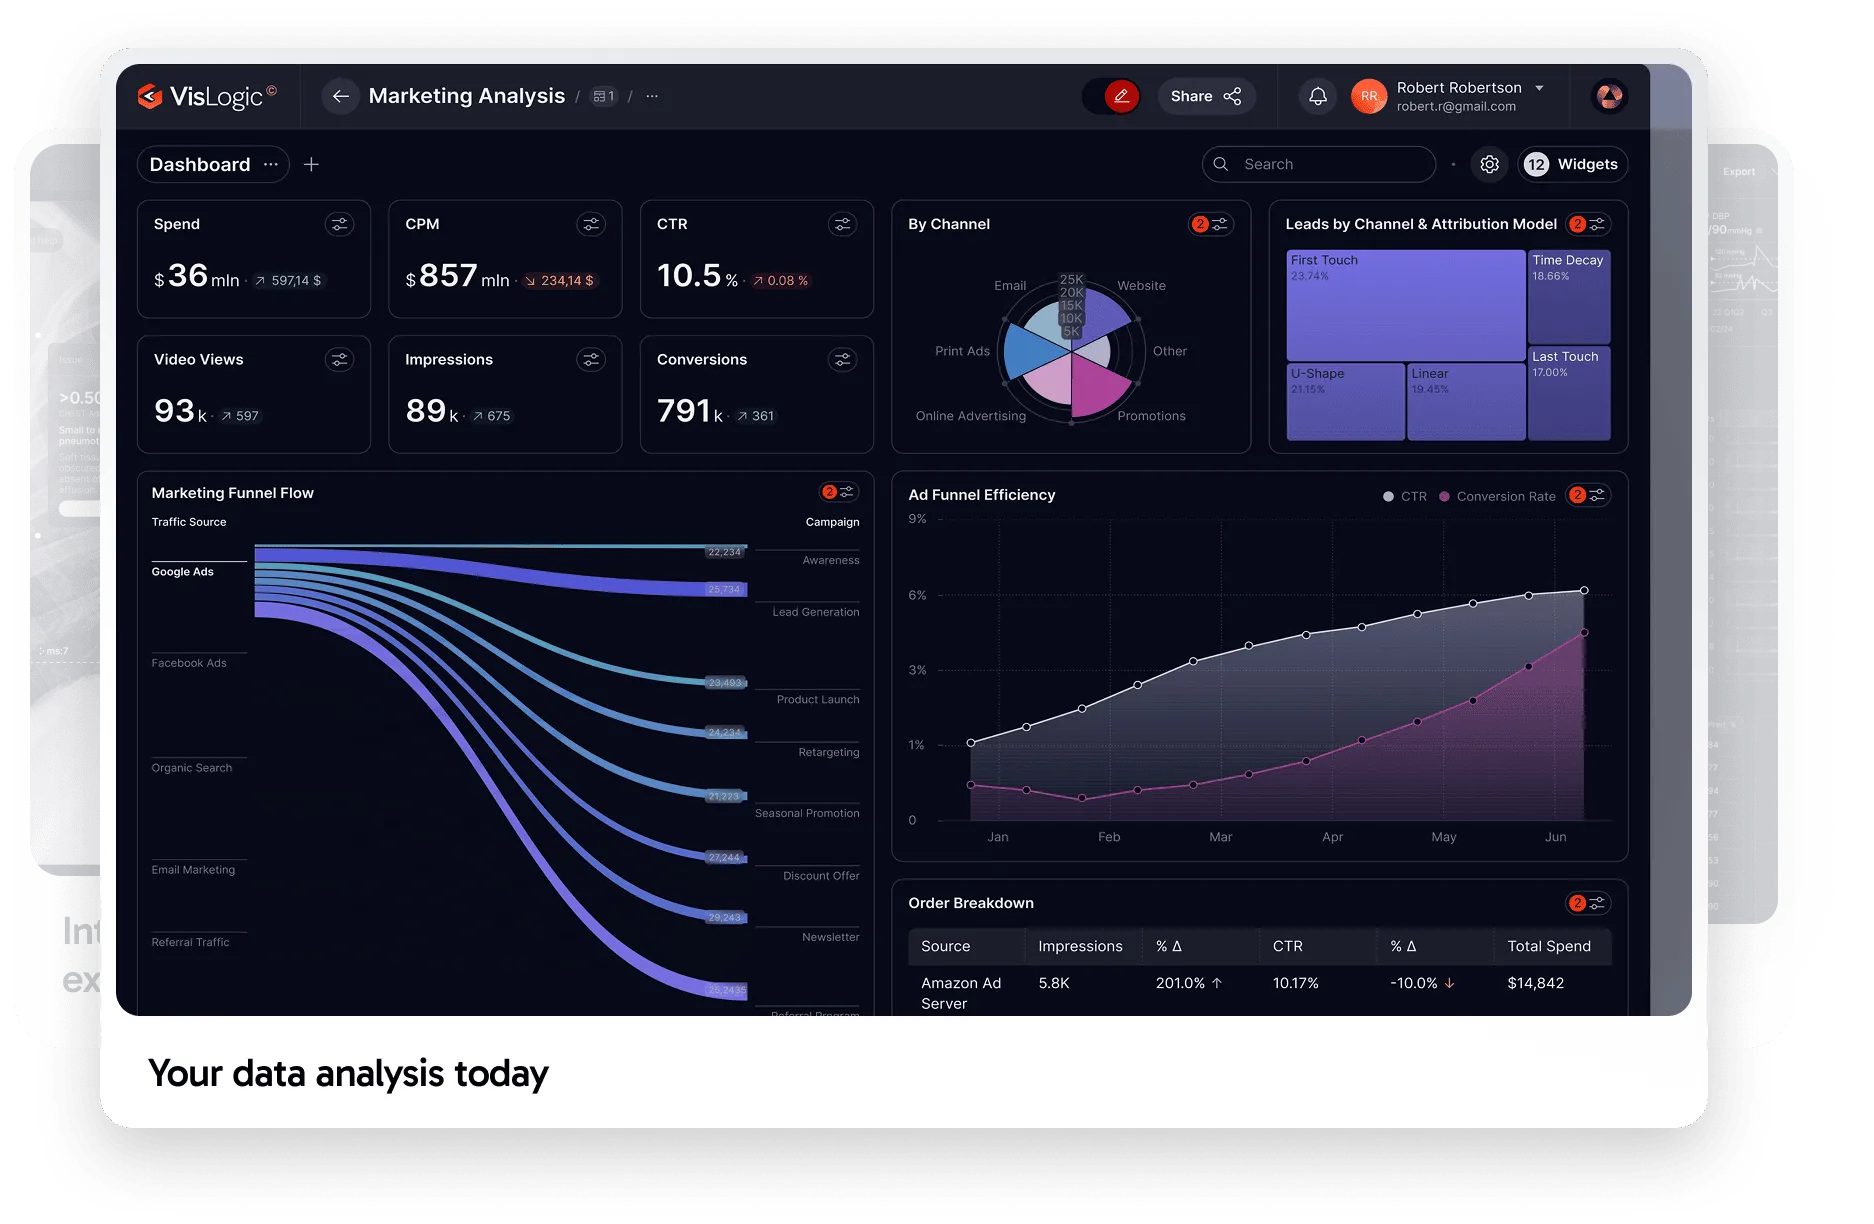
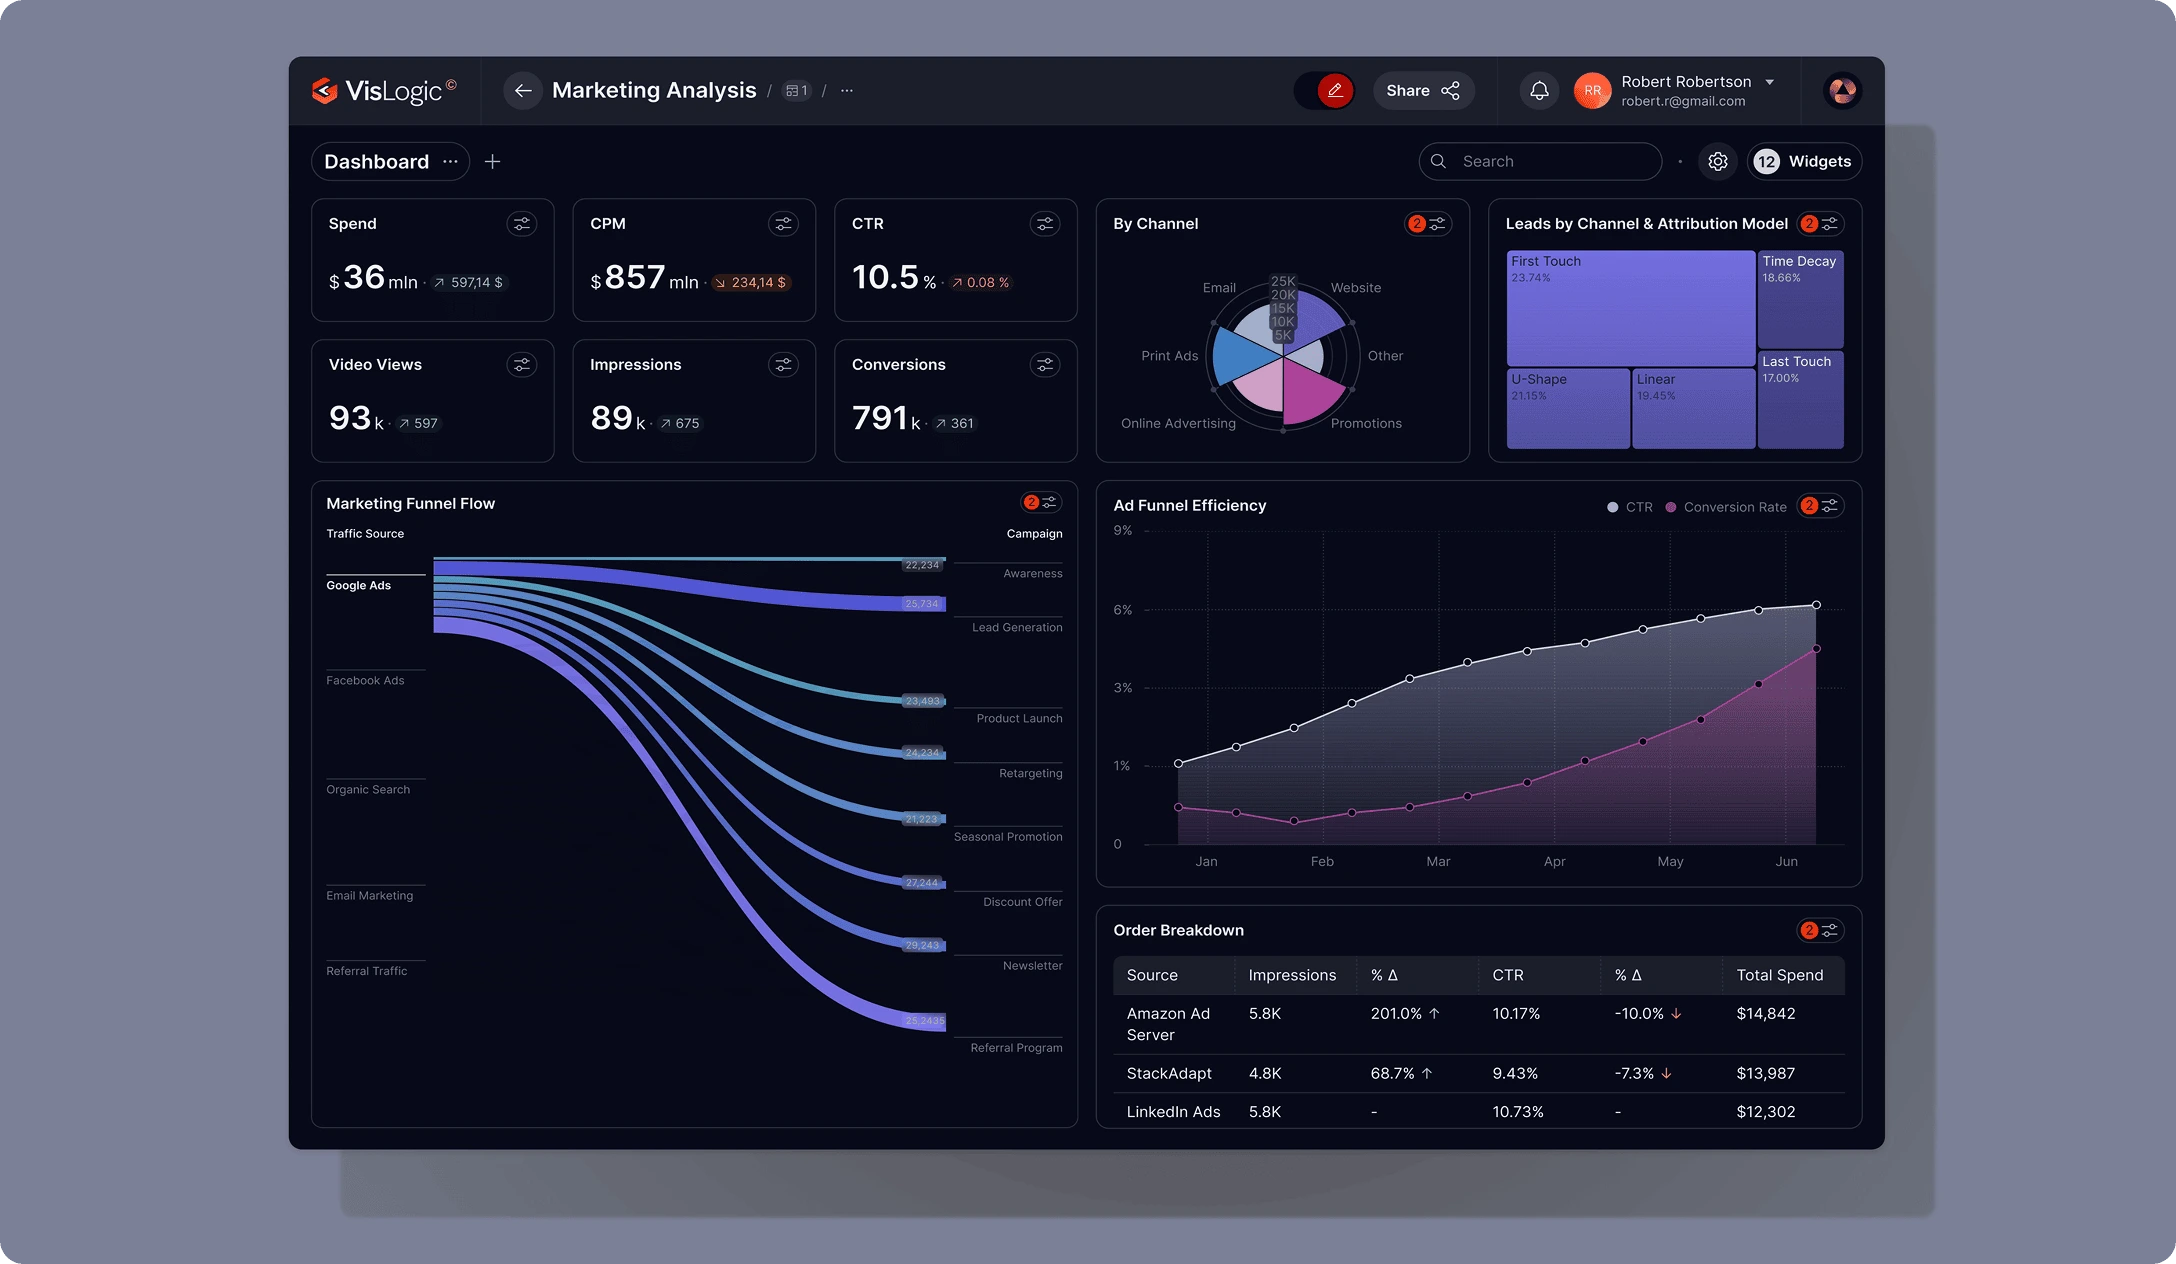
VisLogic transforms marketing data into context-rich insights by connecting campaign performance with external factors influencing consumer behavior. Our platform helps marketers understand what's actually driving results, optimize channel allocation, and improve customer targeting.
Enrich campaign performance data with weather conditions, local events, economic indicators, and seasonal trends to understand external influences on results. Identify the factors that actually drive performance and adjust strategies accordingly.
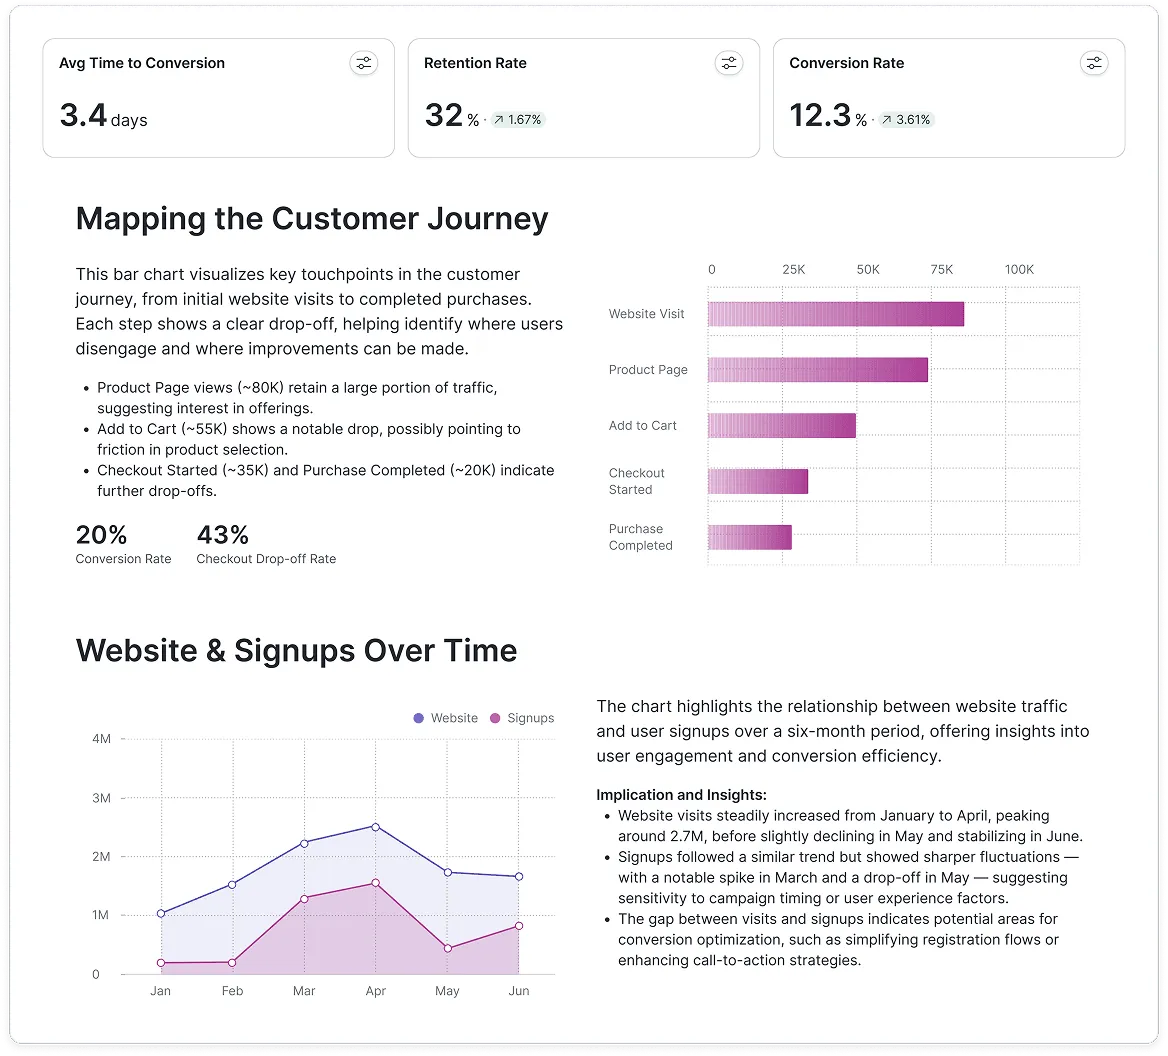
Enhance customer interaction data with behavioral trends, demographic insights, and competitive activities to create more complete customer journey maps. Visualize the impact of external factors on customer decision-making at each touchpoint.
Connect marketing investments to business outcomes through enriched data storytelling. Create clear, compelling visualizations that demonstrate marketing's impact on revenue, customer acquisition, and brand value.
Combine internal customer data with external demographic and behavioral insights to create richer audience segments. Visualize segment characteristics and performance to identify high-value targeting opportunities.
This template connects your campaign data with relevant external factors to provide context for performance fluctuations. Interactive dashboards reveal correlations between marketing results and external events, helping you separate tactical effectiveness from environmental influences.
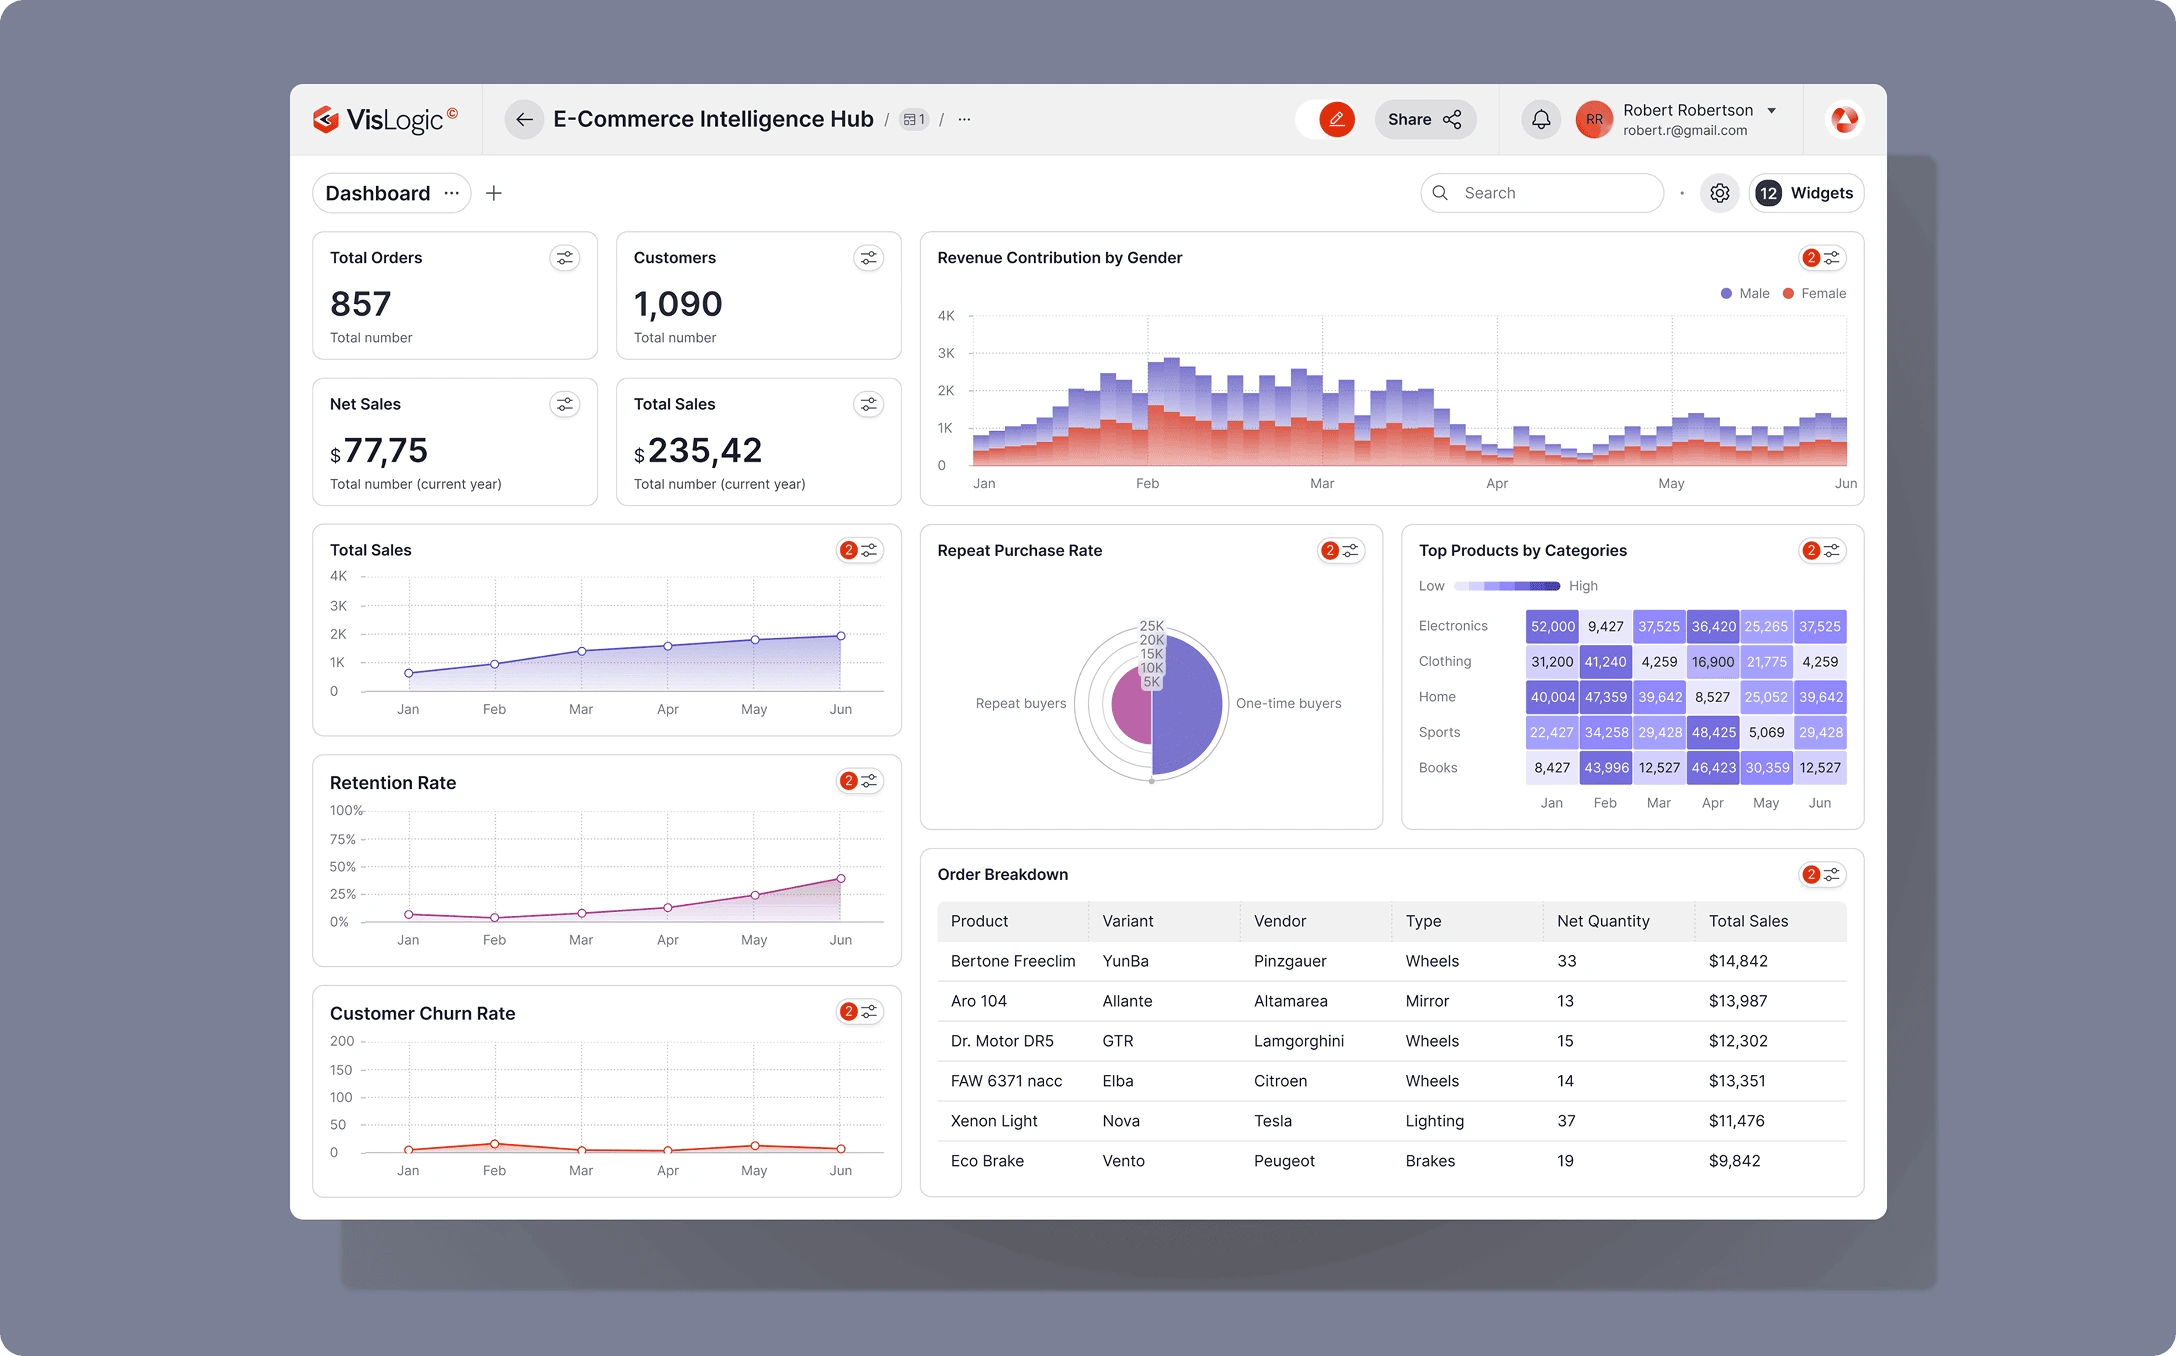
VisLogic delivers comprehensive e-commerce intelligence by connecting customer behavior, sales performance, and inventory data across all digital and physical channels. Our platform enables retailers to understand customer lifetime value, optimize loyalty programs, and create cohesive shopping experiences that drive long-term revenue growth.
Analyze loyalty program data enriched with demographic insights, purchase patterns, and competitive promotions to optimize member engagement and retention. Identify the program elements that drive the highest ROI and customize incentives for different customer segments.
Create dynamic customer cohorts based on acquisition channel, purchase behavior, and lifetime value. Visualize how different cohorts respond to promotions, price changes, and seasonal factors to tailor your marketing and product strategies.
Deploy intelligent AI agents that continuously analyze customer data to predict future value and recommend personalized engagement strategies. Identify high-potential customers early in their journey and optimize marketing spend to maximize long-term revenue.
Visualize the complete customer journey across web, mobile, social commerce, and physical stores. Identify channel-specific patterns, conversion drivers, and optimize the omnichannel experience to increase total customer value.
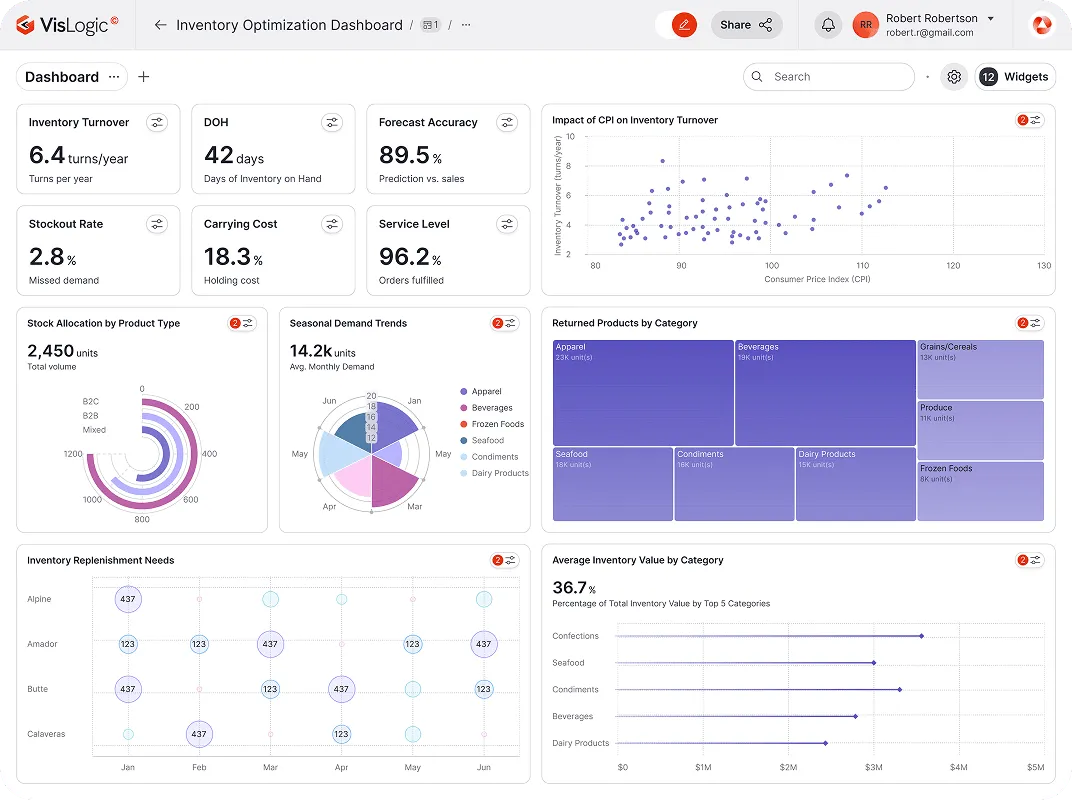
Connect inventory data with sales patterns, customer preferences, and external factors to optimize product assortment and placement across channels. Predict demand fluctuations and automate inventory allocation to maximize sell-through.
This comprehensive template integrates sales, customer, and inventory data across all channels with relevant external factors affecting purchasing behavior. Interactive dashboards highlight key performance metrics, customer lifetime value, cohort analysis, and loyalty program effectiveness with predictive insights for future optimization.
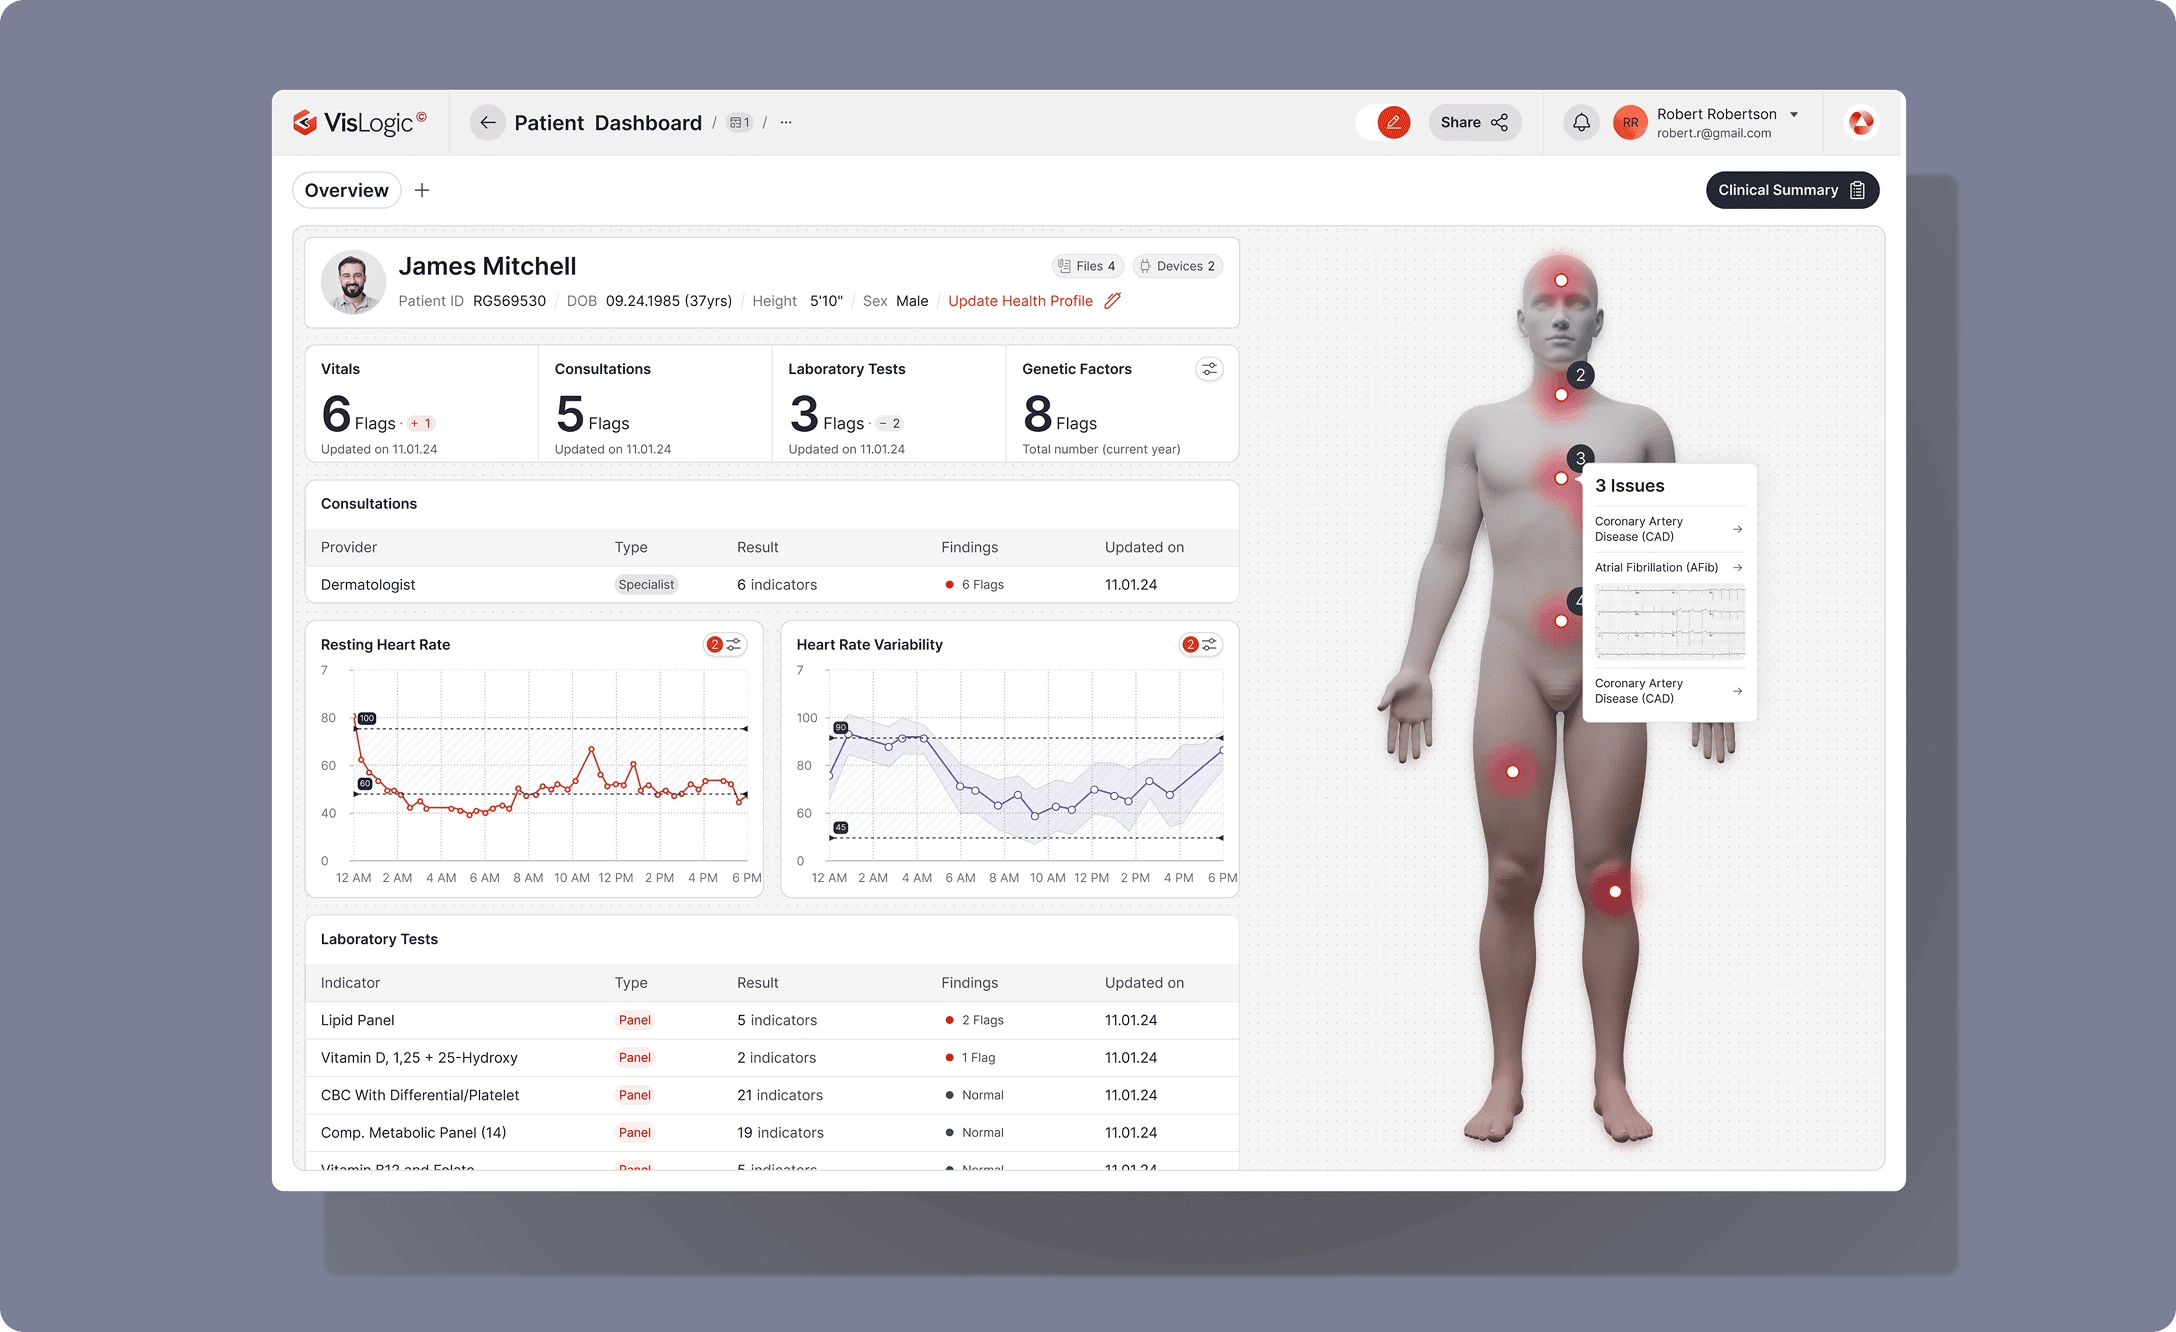
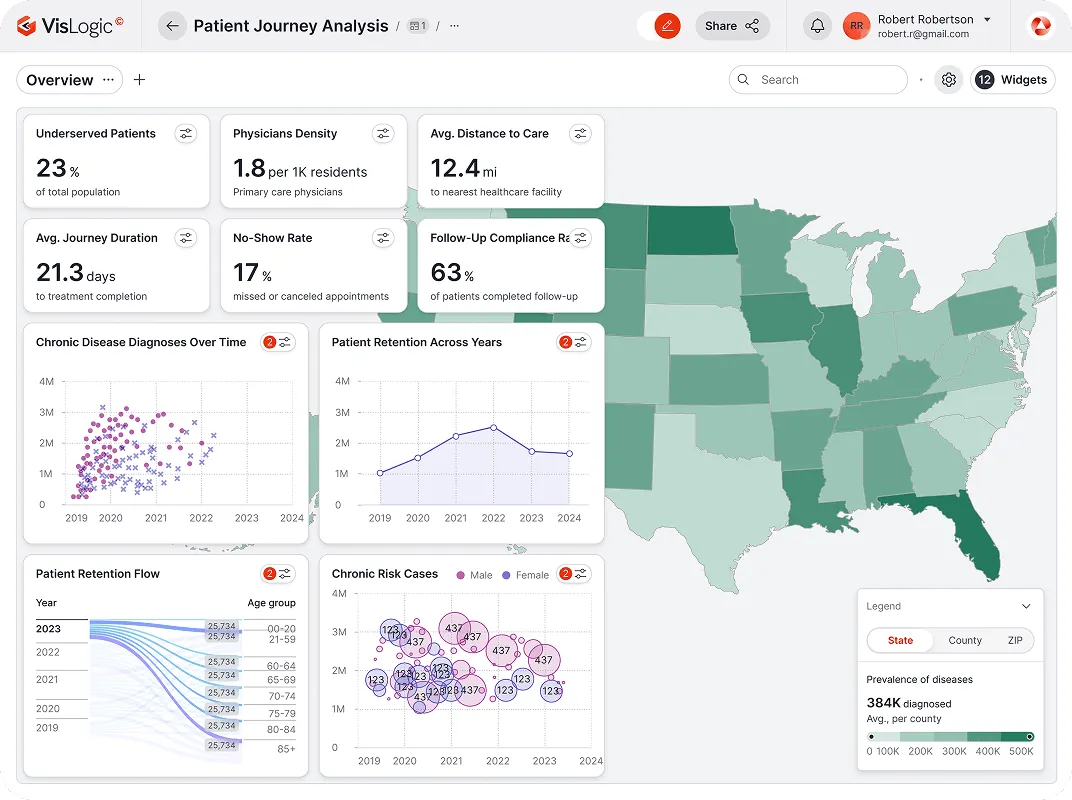
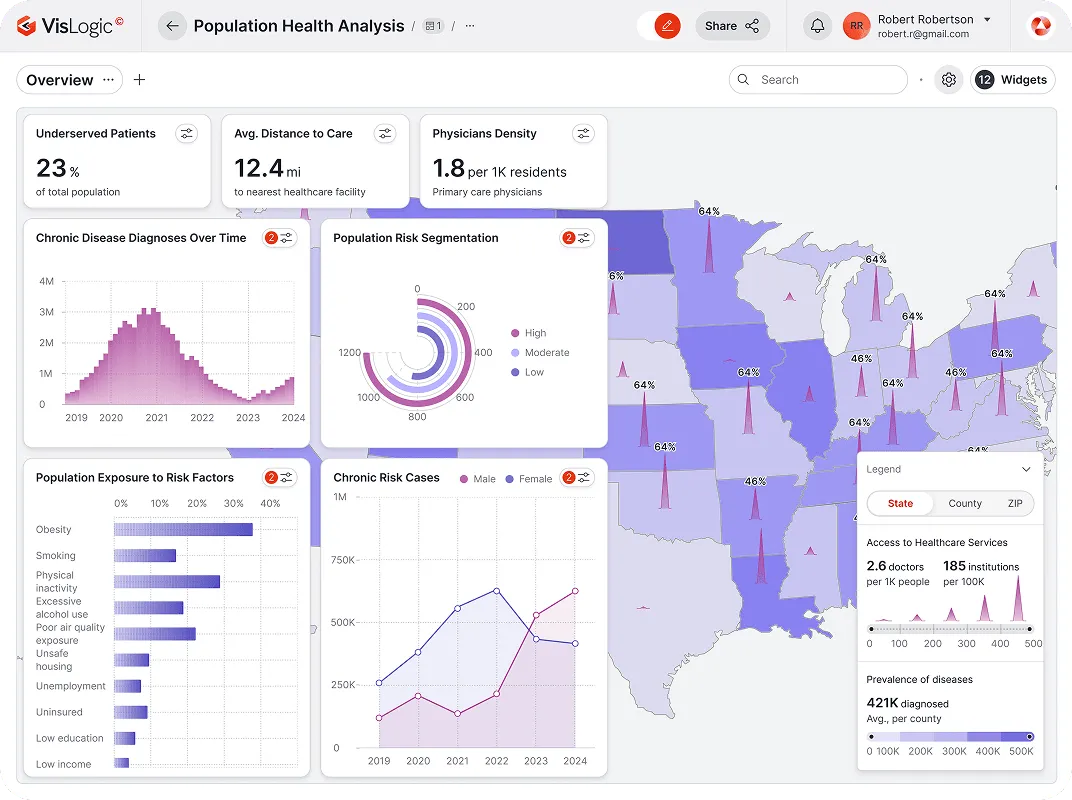
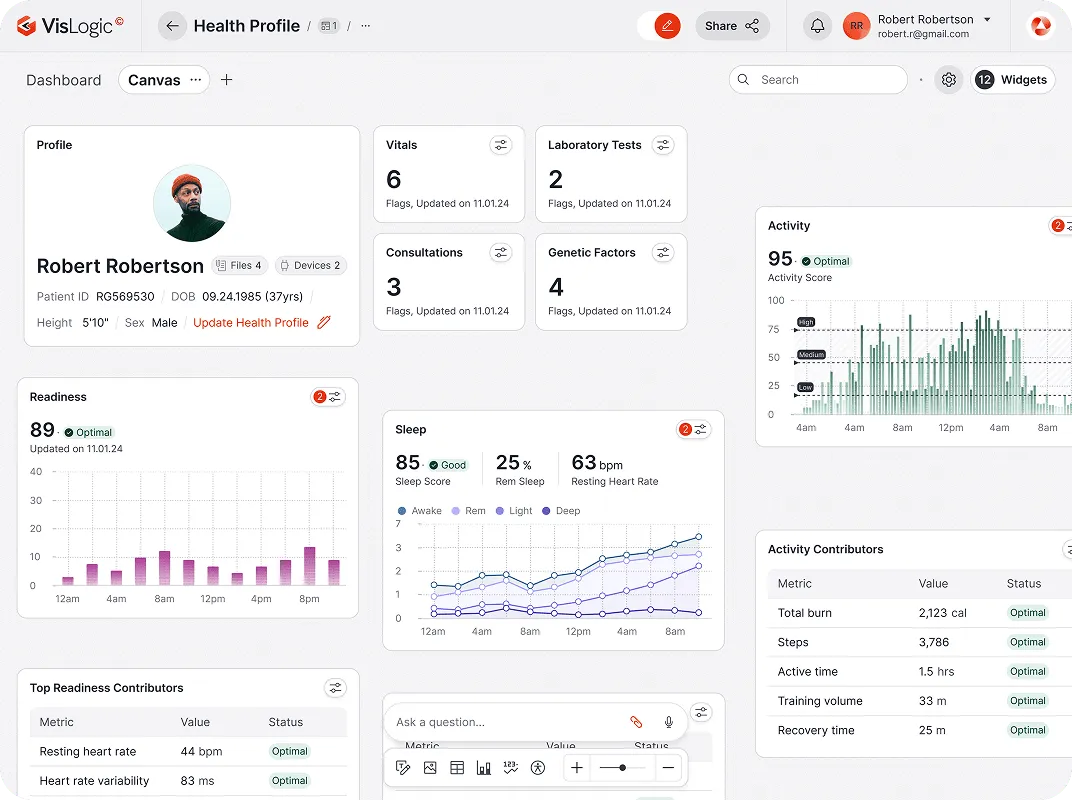
VisLogic helps healthcare organizations transform clinical and operational data into actionable insights by adding crucial external context. Our platform enables healthcare providers to optimize resource allocation, improve patient outcomes, and enhance operational efficiency through enriched data intelligence.
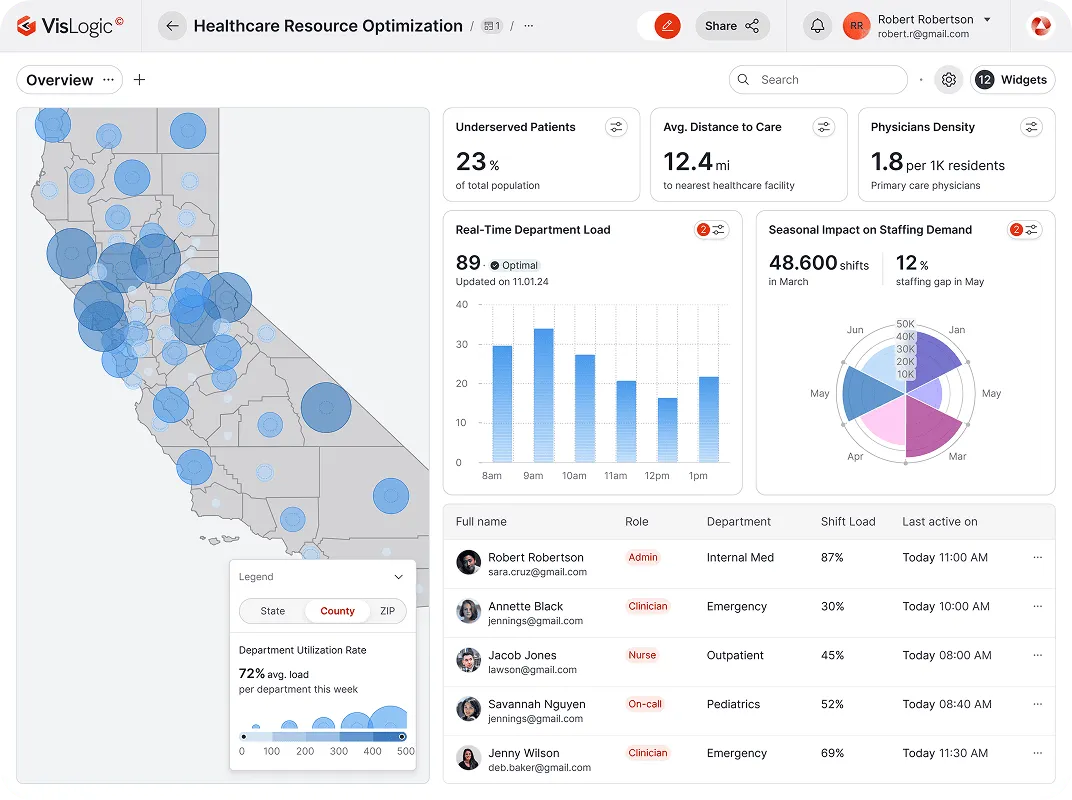
This template integrates your operational data with patient demographics, seasonal patterns, and community factors to provide a comprehensive view of facility performance. Interactive visualizations highlight efficiency opportunities, resource requirements, and quality metrics in a HIPAA-compliant format.