Your Business
Data. Enriched. Simplified.
VisLogic turns raw business data into enriched, contextual insights - instantly.
No code. No data science required.
Multi layer map for Intercity
Mauris dolor felis, sagittis at, luctus sed, aliquam non, tellus. Nam sed tellus id magna elementum tincidunt.
Interactive 3d body for Referralmd
Mauris dolor felis, sagittis at, luctus sed, aliquam non, tellus. Nam sed tellus id magna elementum tincidunt.
Interactive Dashboard for DHCS
Mauris dolor felis, sagittis at, luctus sed, aliquam non, tellus. Nam sed tellus id magna elementum tincidunt.
Trusted by the biggest companies
See the Difference in Your Results
VisLogic combines simplicity with a robust suite of advanced tools and services, perfectly tailored to businesses of all sizes, offering a solution unlike anything else on the market.
01
Upload your CSV
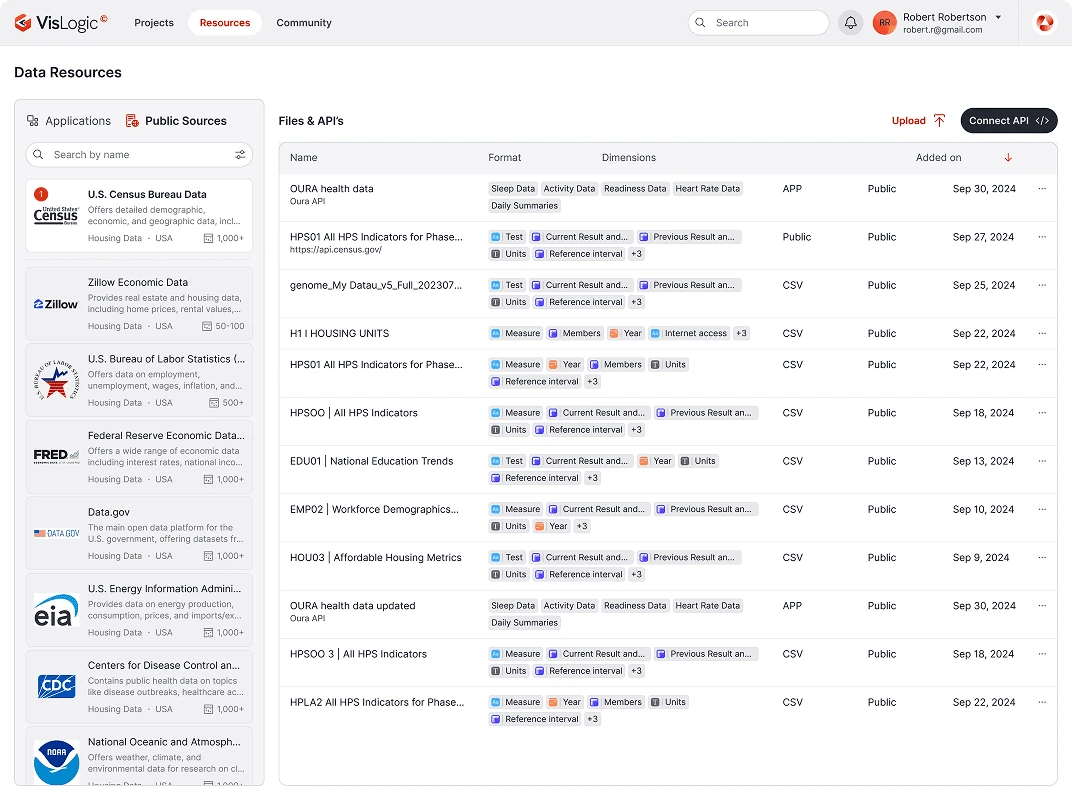
Quickly upload and integrate your structured data for instant enrichment.
02
Connect your API Rest
Seamlessly pull live data from your existing systems. for instant enrichment.
03
Connect to Public Data
Enhance your data with real-time external insights from trusted sources.
04
Build Your Own AI Agent
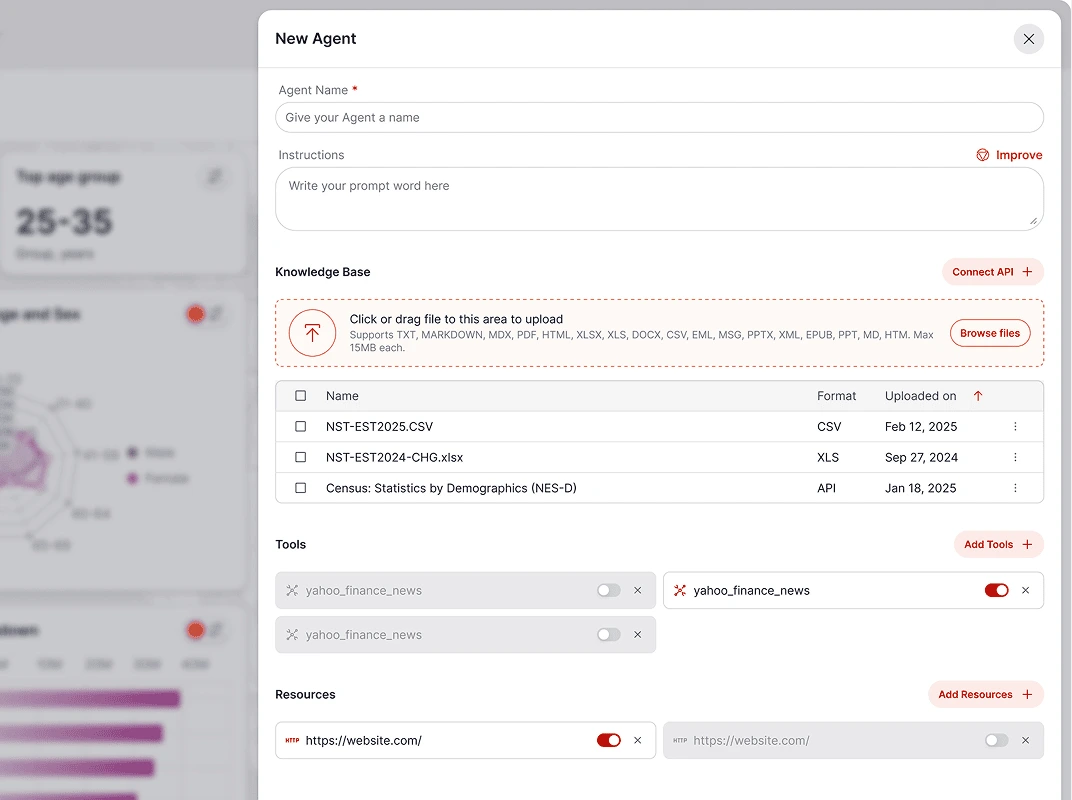
Customize and deploy AI models to analyze, enrich, and visualize your data with unprecedented precision.
05
View on VisLogic
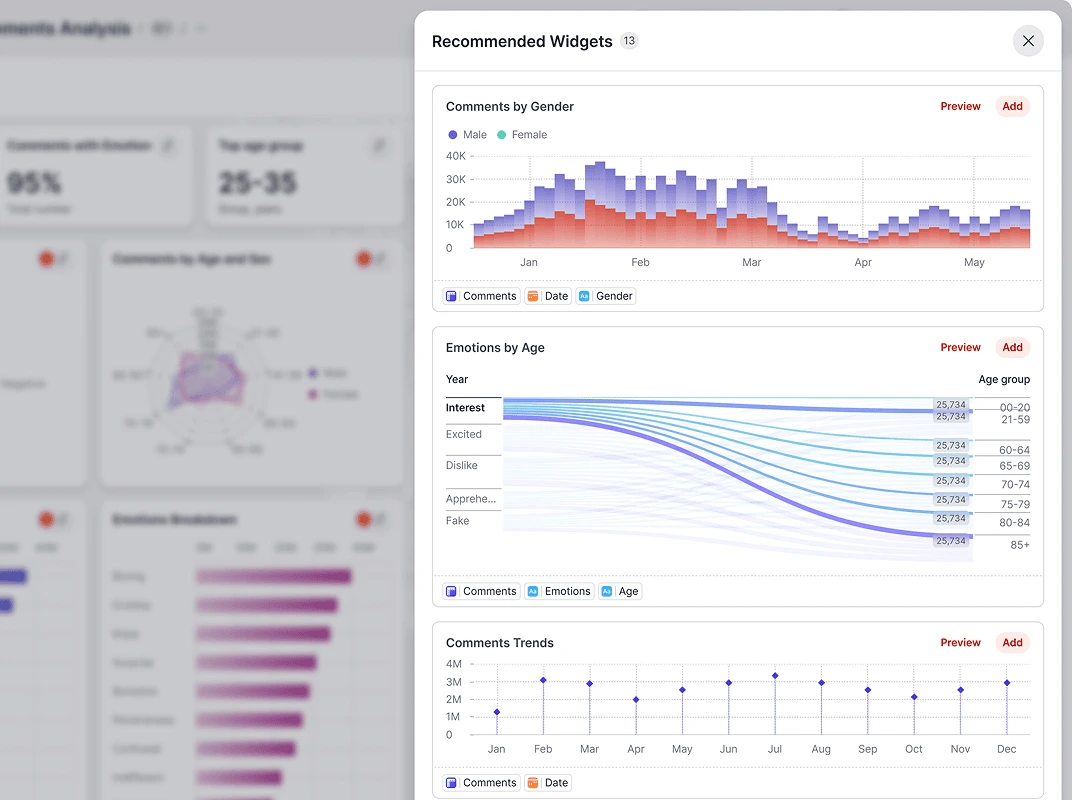
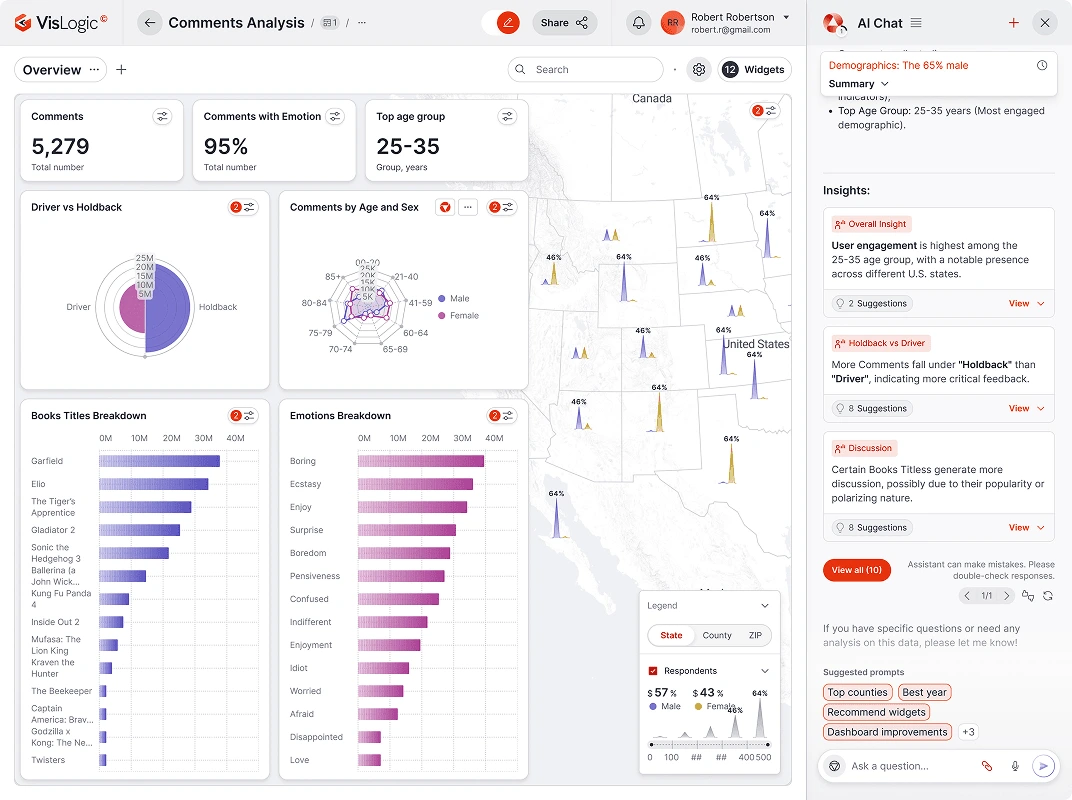
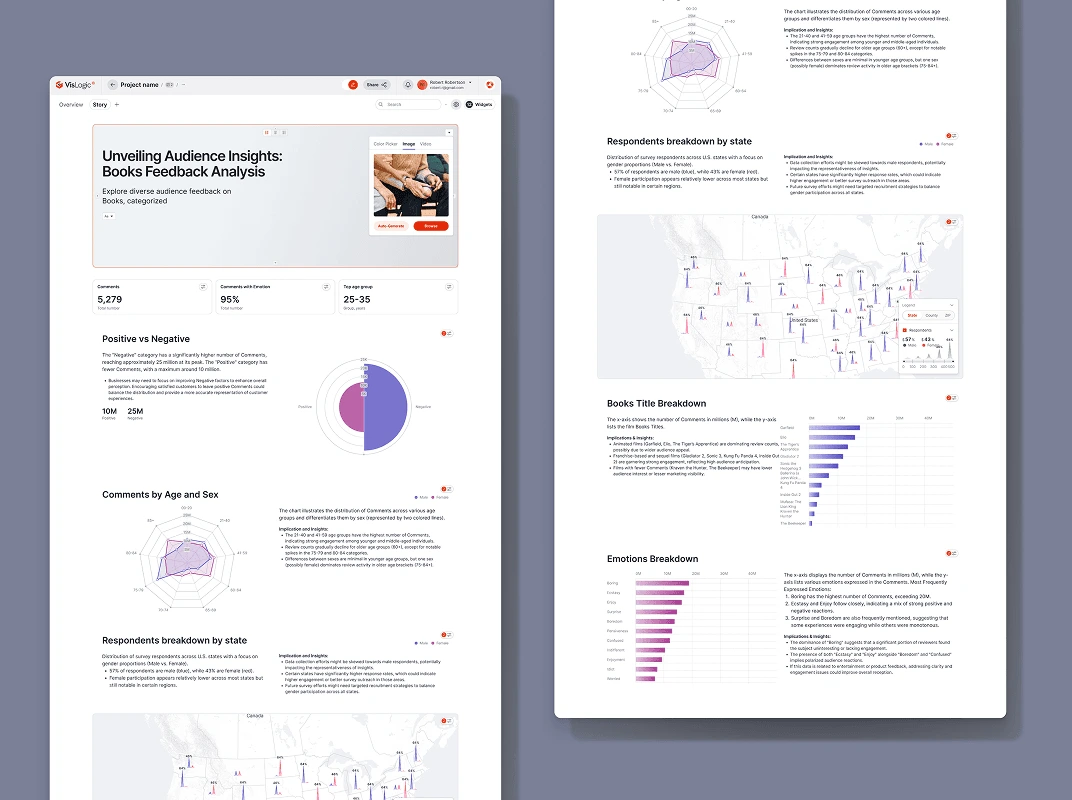
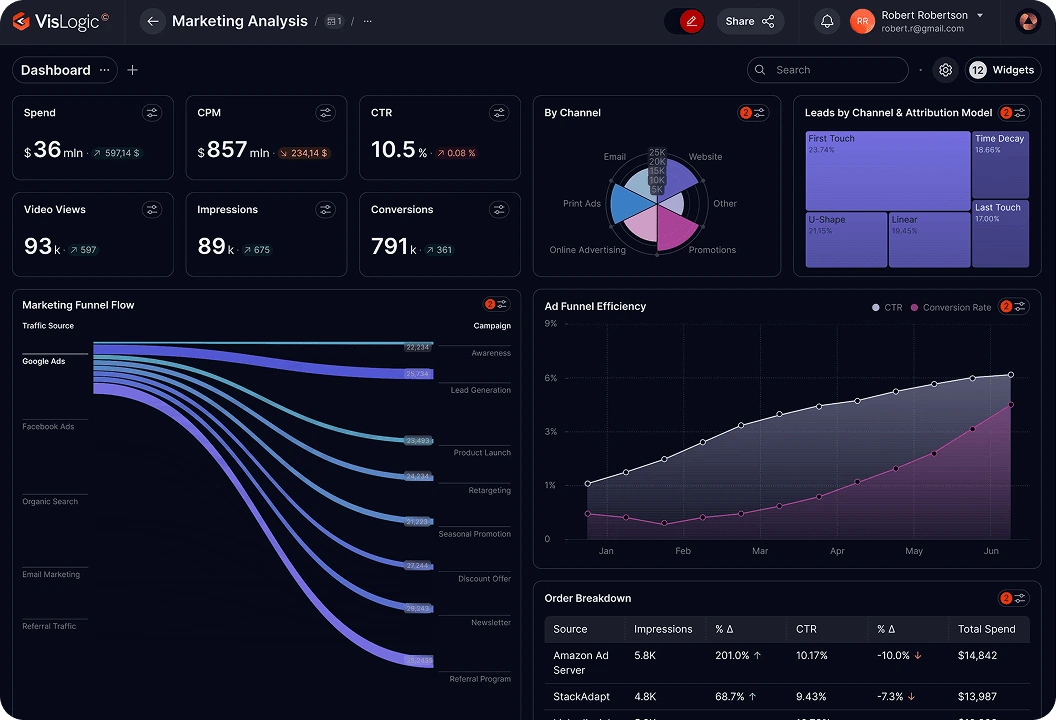
Interactive dashboards and AI-driven storytelling for a seamless experience.or instant enrichment.
06
Copy Embedded Item
Easily share enriched data insights across teams and platforms.
# Real Results
Customer stories
Accelerate your wireframing workflow using pre-build components or combine your own.
Healthcare
125+
Interactive Charts
25+
Dynamic Map Layers
45
Unique Object Types
Lorem ipsum dolor sit amet:
EHR
EHR interface design that understands the time-sensitive medical provider’s world and the need for hierarchal data organization.
Public Health
Since the Covid-19 epidemic the whole world better understands the effectiveness of data visualization to explain complex issues.
Treatment & Trials Analytics
New treatments and clinical trials are taking place every day, only with tools like Fusdash can this world be made clear.
Multidimensional Data Viz
Some types of data are better visualized with 3-Dimensional graphics, and treating human beings happens to be a prime candidate.
Read More
AI
300+
Office ipsum
15k
Figma ipsum
89%
Office ipsum
Lorem ipsum dolor sit amet:
Predictive Analytics
Lorem ipsum
Generative AI
Lorem ipsum
Healthcare Diagnostics
Lorem ipsum
Business Intelligence
Lorem ipsum
Read More
Manufacture and Warehousing
300+
Office ipsum
15k
Figma ipsum
89%
Office ipsum
Lorem ipsum dolor sit amet:
AGV (Automated Guided Vehicle)
Lorem ipsum
Supply Chain
Lorem ipsum
Cyber Security
Lorem ipsum
Fleet Management
Lorem ipsum
Read More
Real Estate
300+
Office ipsum
15k
Figma ipsum
89%
Office ipsum
Lorem ipsum dolor sit amet:
Valuation Calculator
Lorem ipsum
Neighborhood Demographics
Lorem ipsum
Schools
Lorem ipsum
Access to Food & Services
Lorem ipsum
Read More
Finance
300+
Office ipsum
15k
Figma ipsum
89%
Office ipsum
Lorem ipsum dolor sit amet:
Monthly Detailed Reporting
Lorem ipsum
Index Score by Industry
Lorem ipsum
Interactive Mapping & Search
Lorem ipsum
Year and Month Fluctuations
Lorem ipsum
Read More
Non profit
300+
Office ipsum
15k
Figma ipsum
89%
Office ipsum
Lorem ipsum dolor sit amet:
Robust Search
Lorem ipsum
GIS Mapping
Lorem ipsum
Advanced Filtering
Lorem ipsum
Heat Mapping
Lorem ipsum
Read More
How It Works
Step 1
Upload your data
CSV, API, or integrations
Step 2
AI enriches it instantly
Smart suggestions for external insights
Step 3
Build and Deploy AI Agents
Custom AI-driven automation to analyze and visualize data tailored to your needs.
Step 4
Create stunning visuals effortlessly
No-code, AI-powered data storytelling
Step 5
Collaborate & Share
Get the whole team aligned on insights that matter.
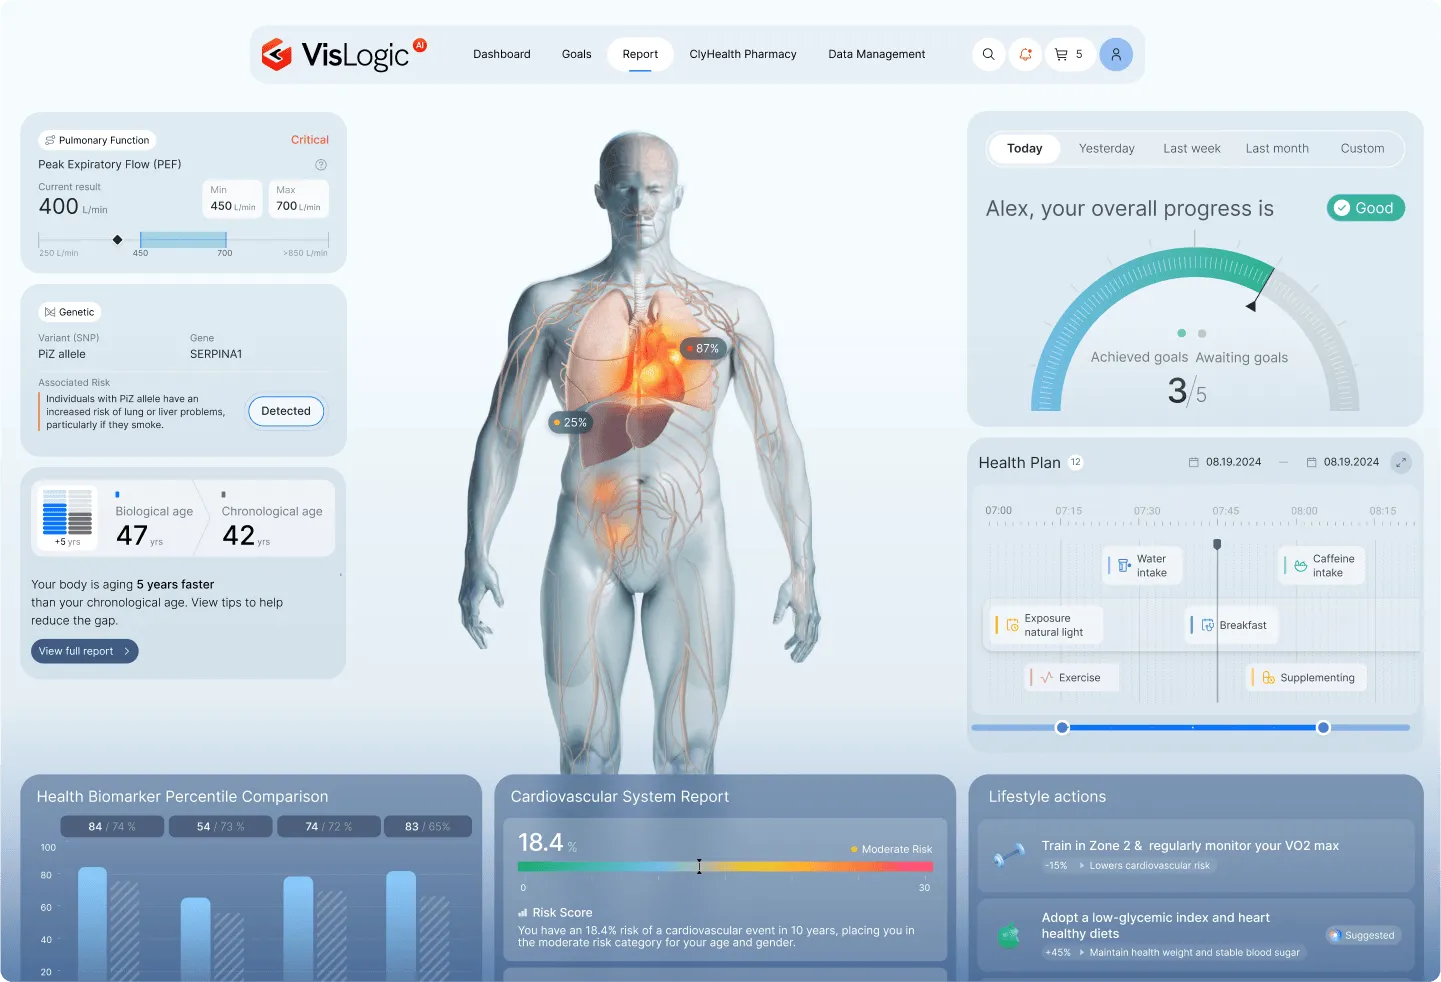
Sign up to apply for our beta program now
Opened Beta 2.0
For Product Owners
Understanding and monitoring the success and pitfalls of your product in real-time is simply an unfair advantage over your competitors.
Read More
For everyone that wants to enhance a dashboard or interface
We are all different, and we have particular needs and goals, this is why we created Fusedash, where personalization options reign supreme.
Read More
For BI/ML Teams
Imagine a dashboard and data visualization system that takes your current models and produces insights ever day and automatically.  
Read More
Use Cases
Retail & E-Commerce
Optimize inventory and sales with demand-driving insights like weather, events, and local trends.
Real Estate & Market Intelligence
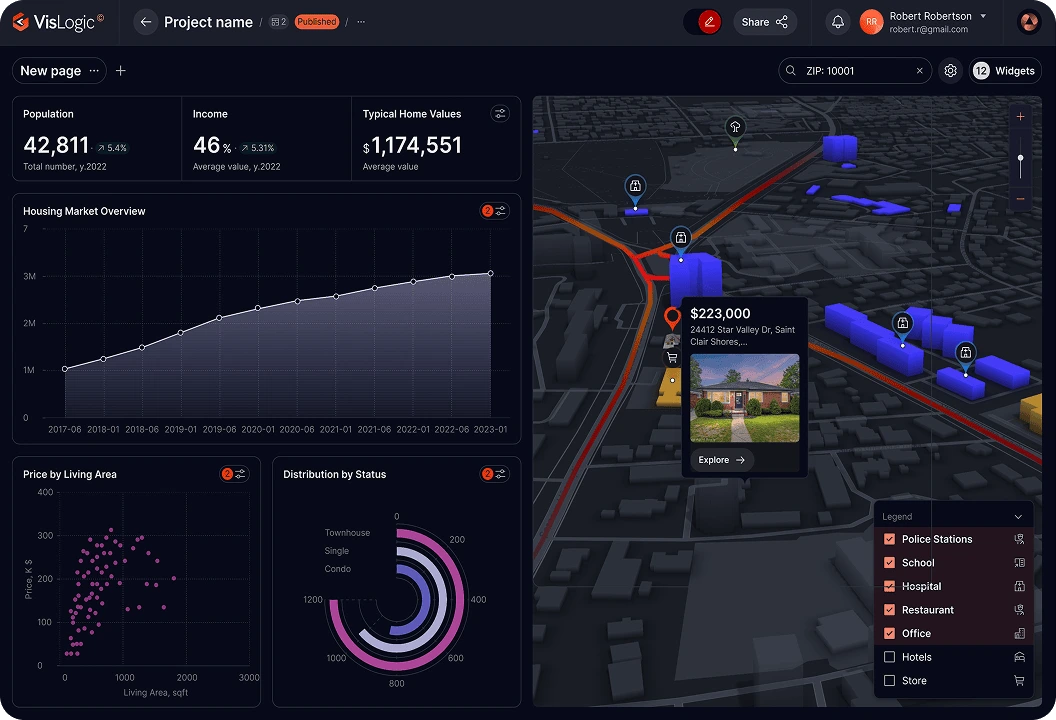
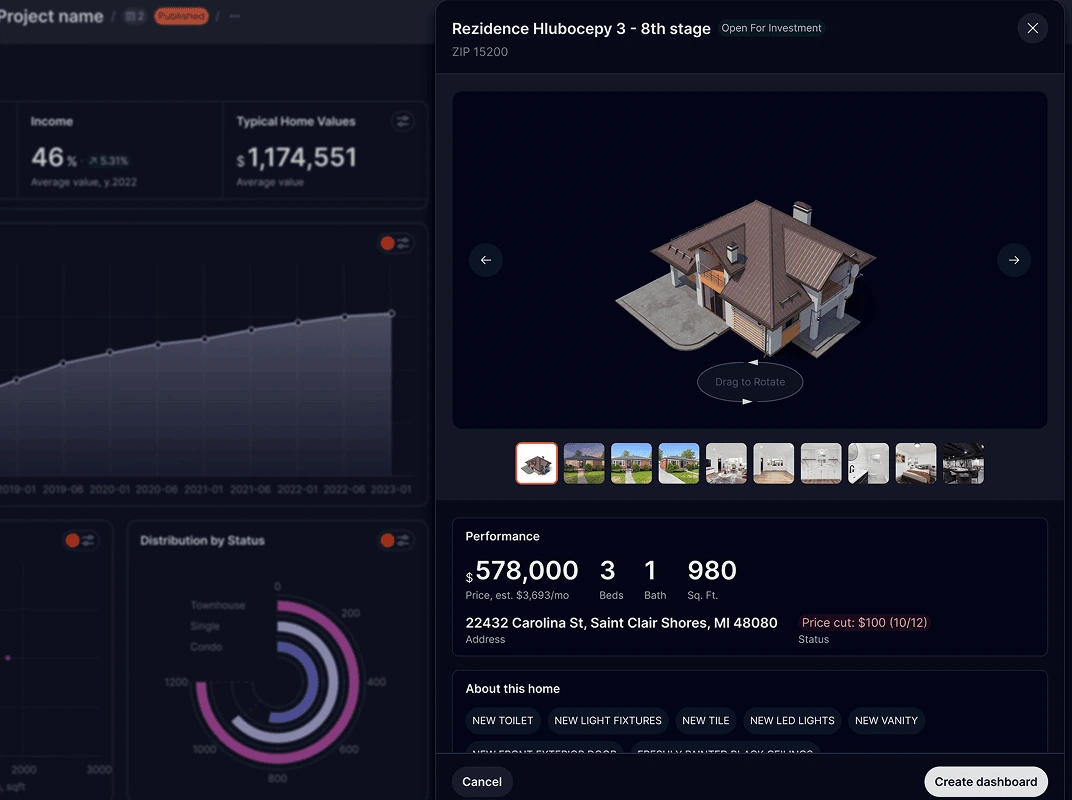
Layer in crime rates, census data, and school ratings for a smarter investment strategy.
Marketing & Campaign Optimization
Understand how external trends impact ad performance. Target the right audience at the right time.
Discover more
Enterprise-Grade Security & Compliance
Built with healthcare-grade security. All data encrypted at rest and in transit. Complete audit logging and role-based access control.
HIPAA
Available
GDPR
Available
ISO 27001
Available
SOC2
In progress
Discover all the Security details
Community & Resources
Guides & Playbooks
The Future of AI-Powered Business Intelligence
Read Now
Guides & Playbooks
The Future of AI-Powered Business Intelligence
Learn More
Guides & Playbooks
The Future of AI-Powered Business Intelligence
Sign Up
Your data deserves better
Get started today